
Real Estate for Sale in Lancaster, South Glengarry, ON
Loading homes in Lancaster…
No listings match these filters in this area.
Try zooming out or widening your filters.
Neighbourhood in South Glengarry
Lancaster
Lancaster is a small neighbourhood in South Glengarry, Ontario. It offers a quiet lifestyle with basic amenities and local parks.
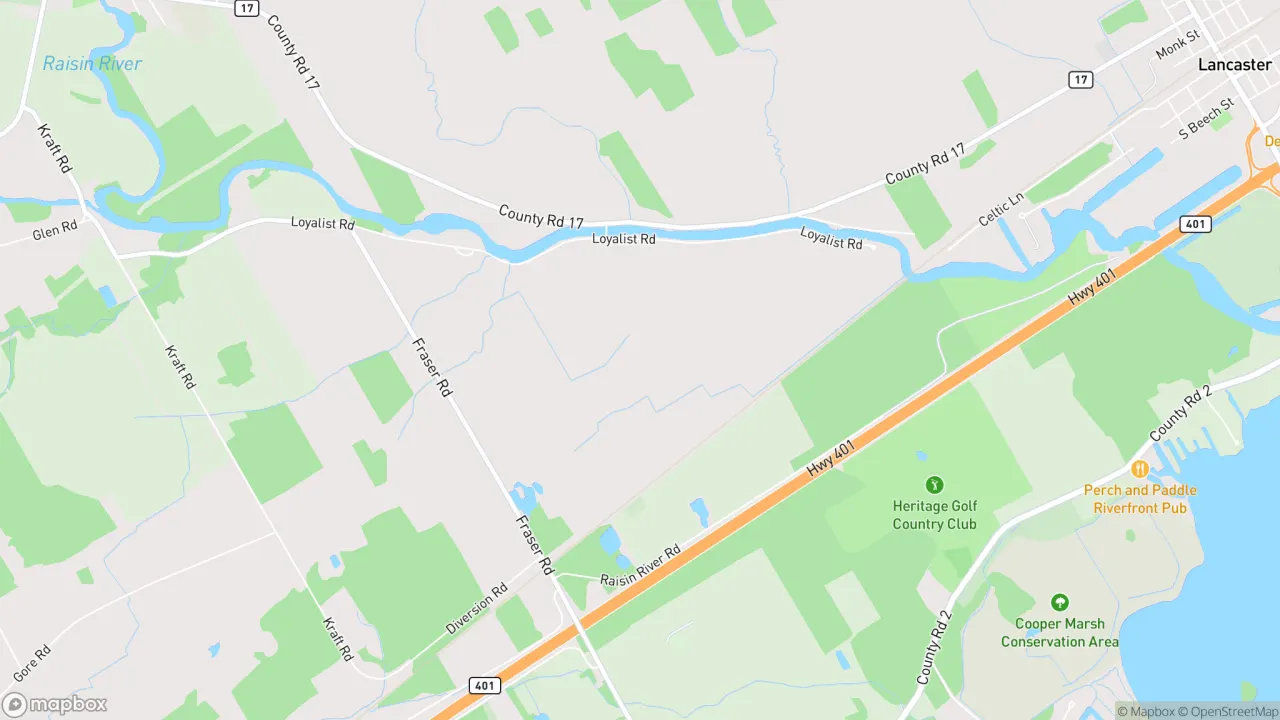
South Glengarry, Ontario
© Mapbox © OpenStreetMap
At a glance
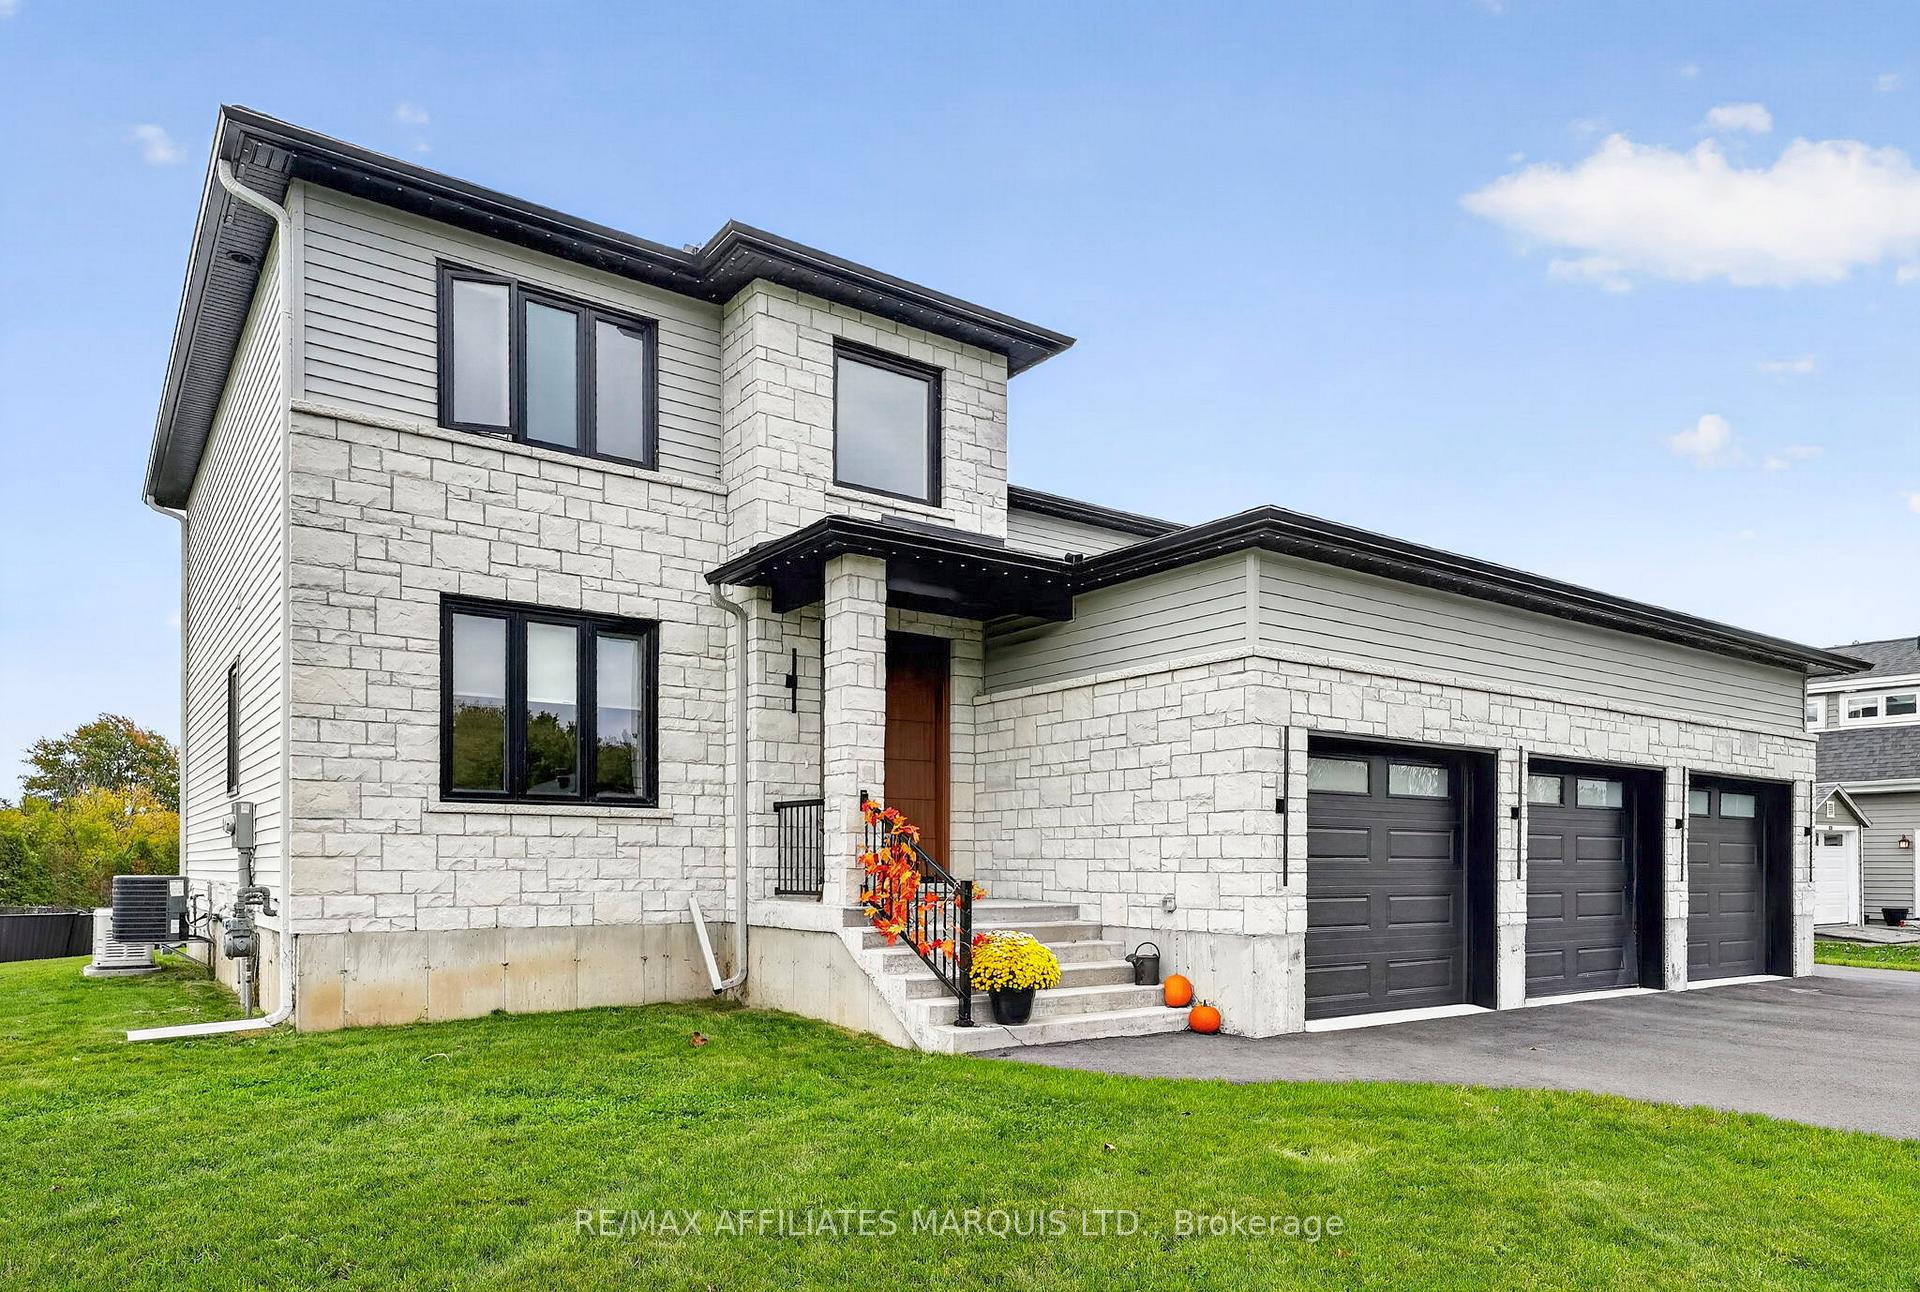
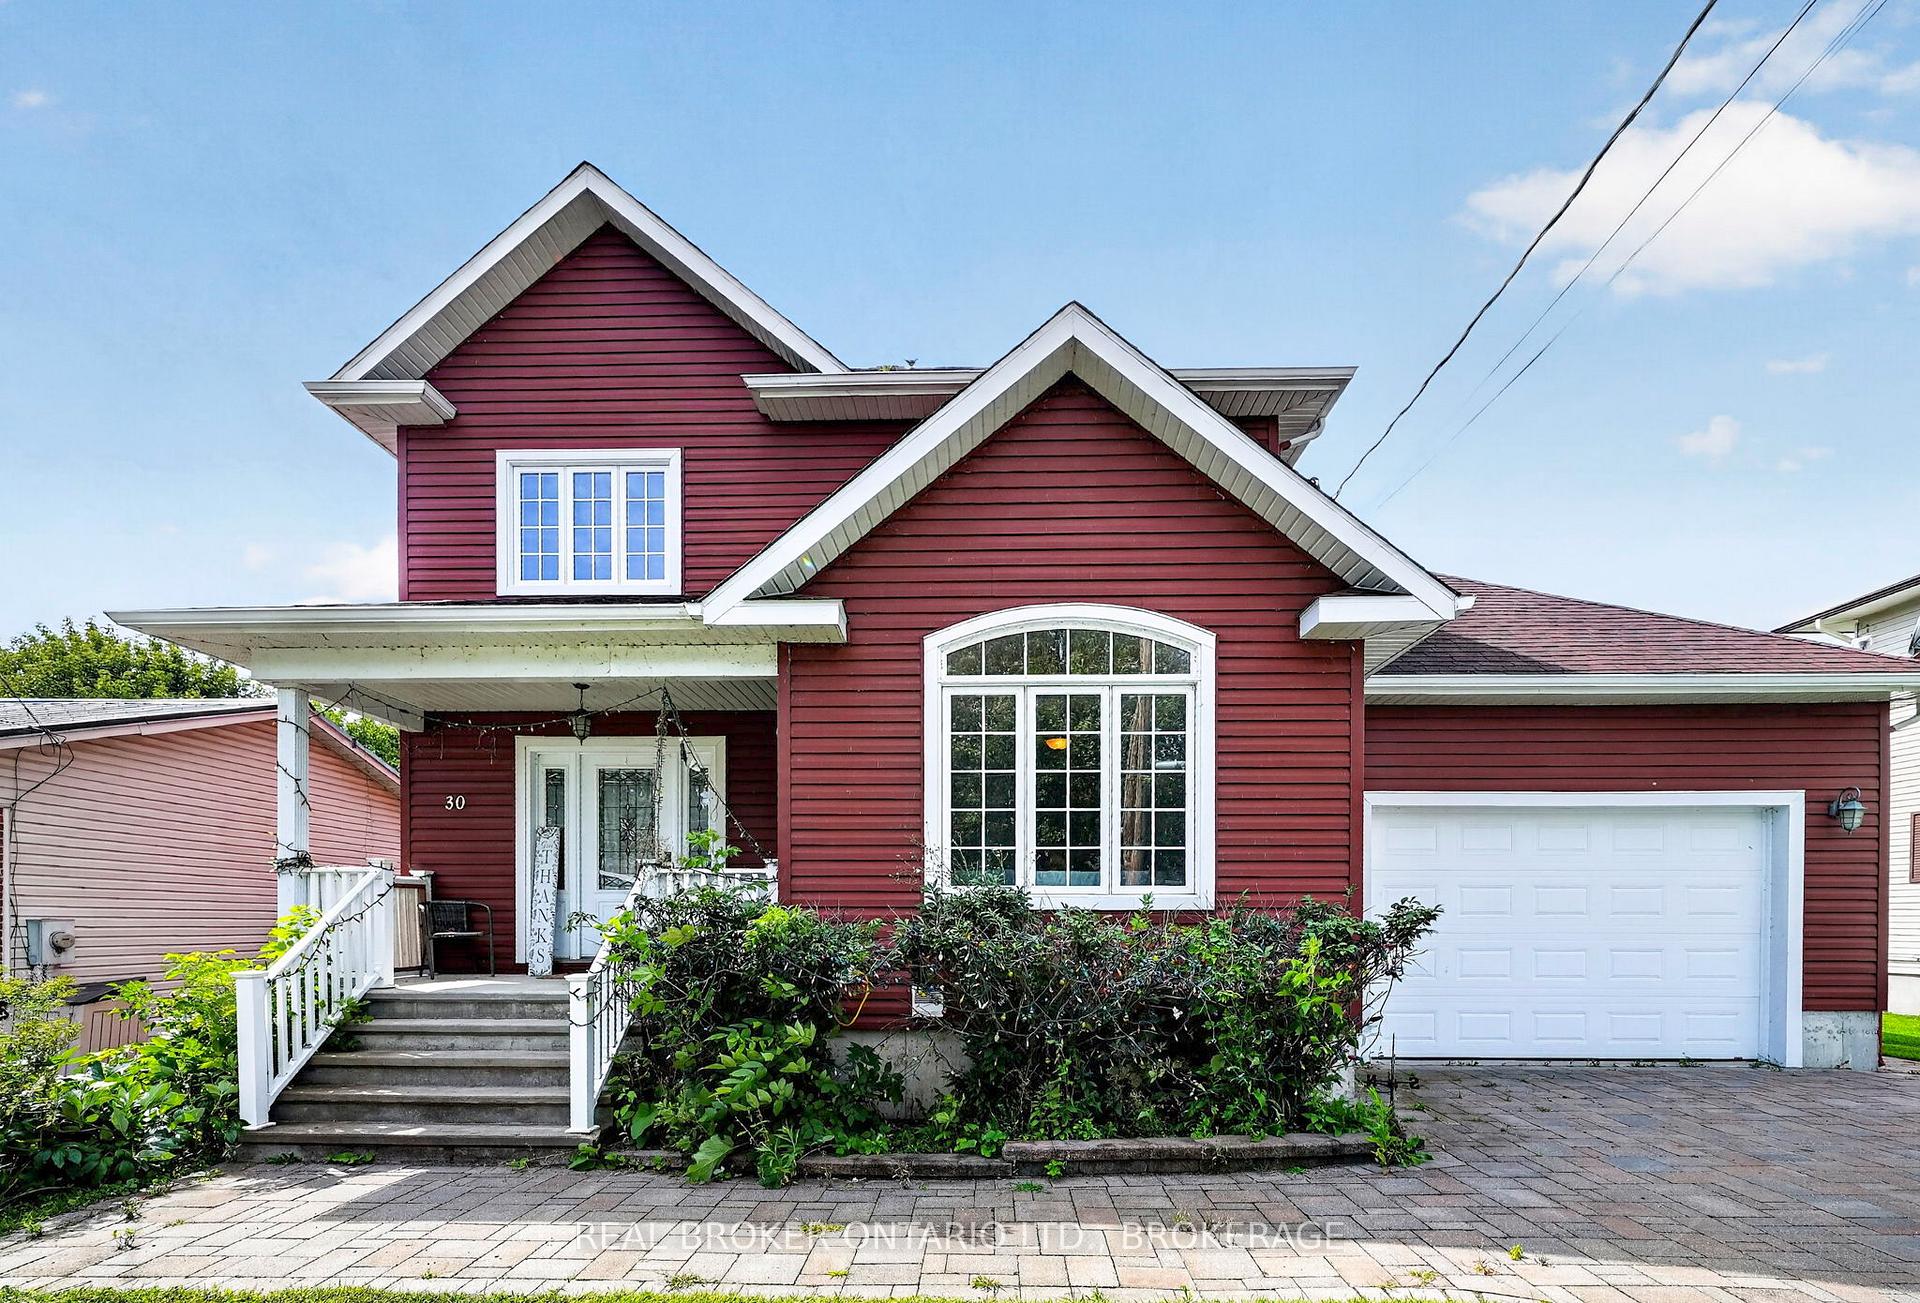
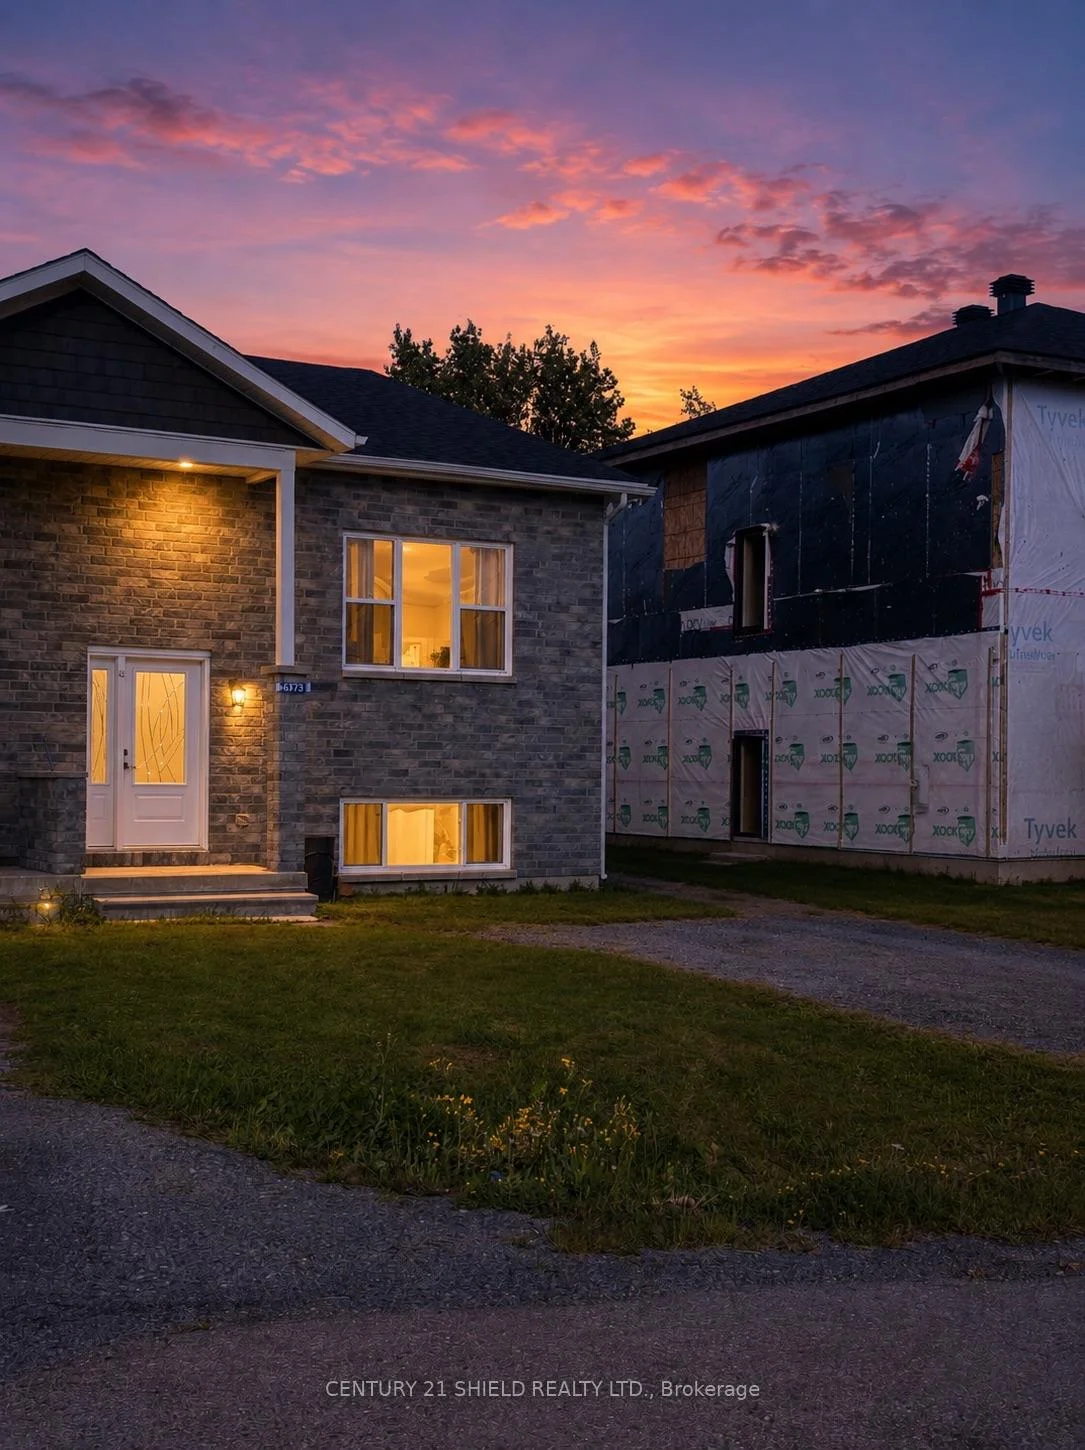
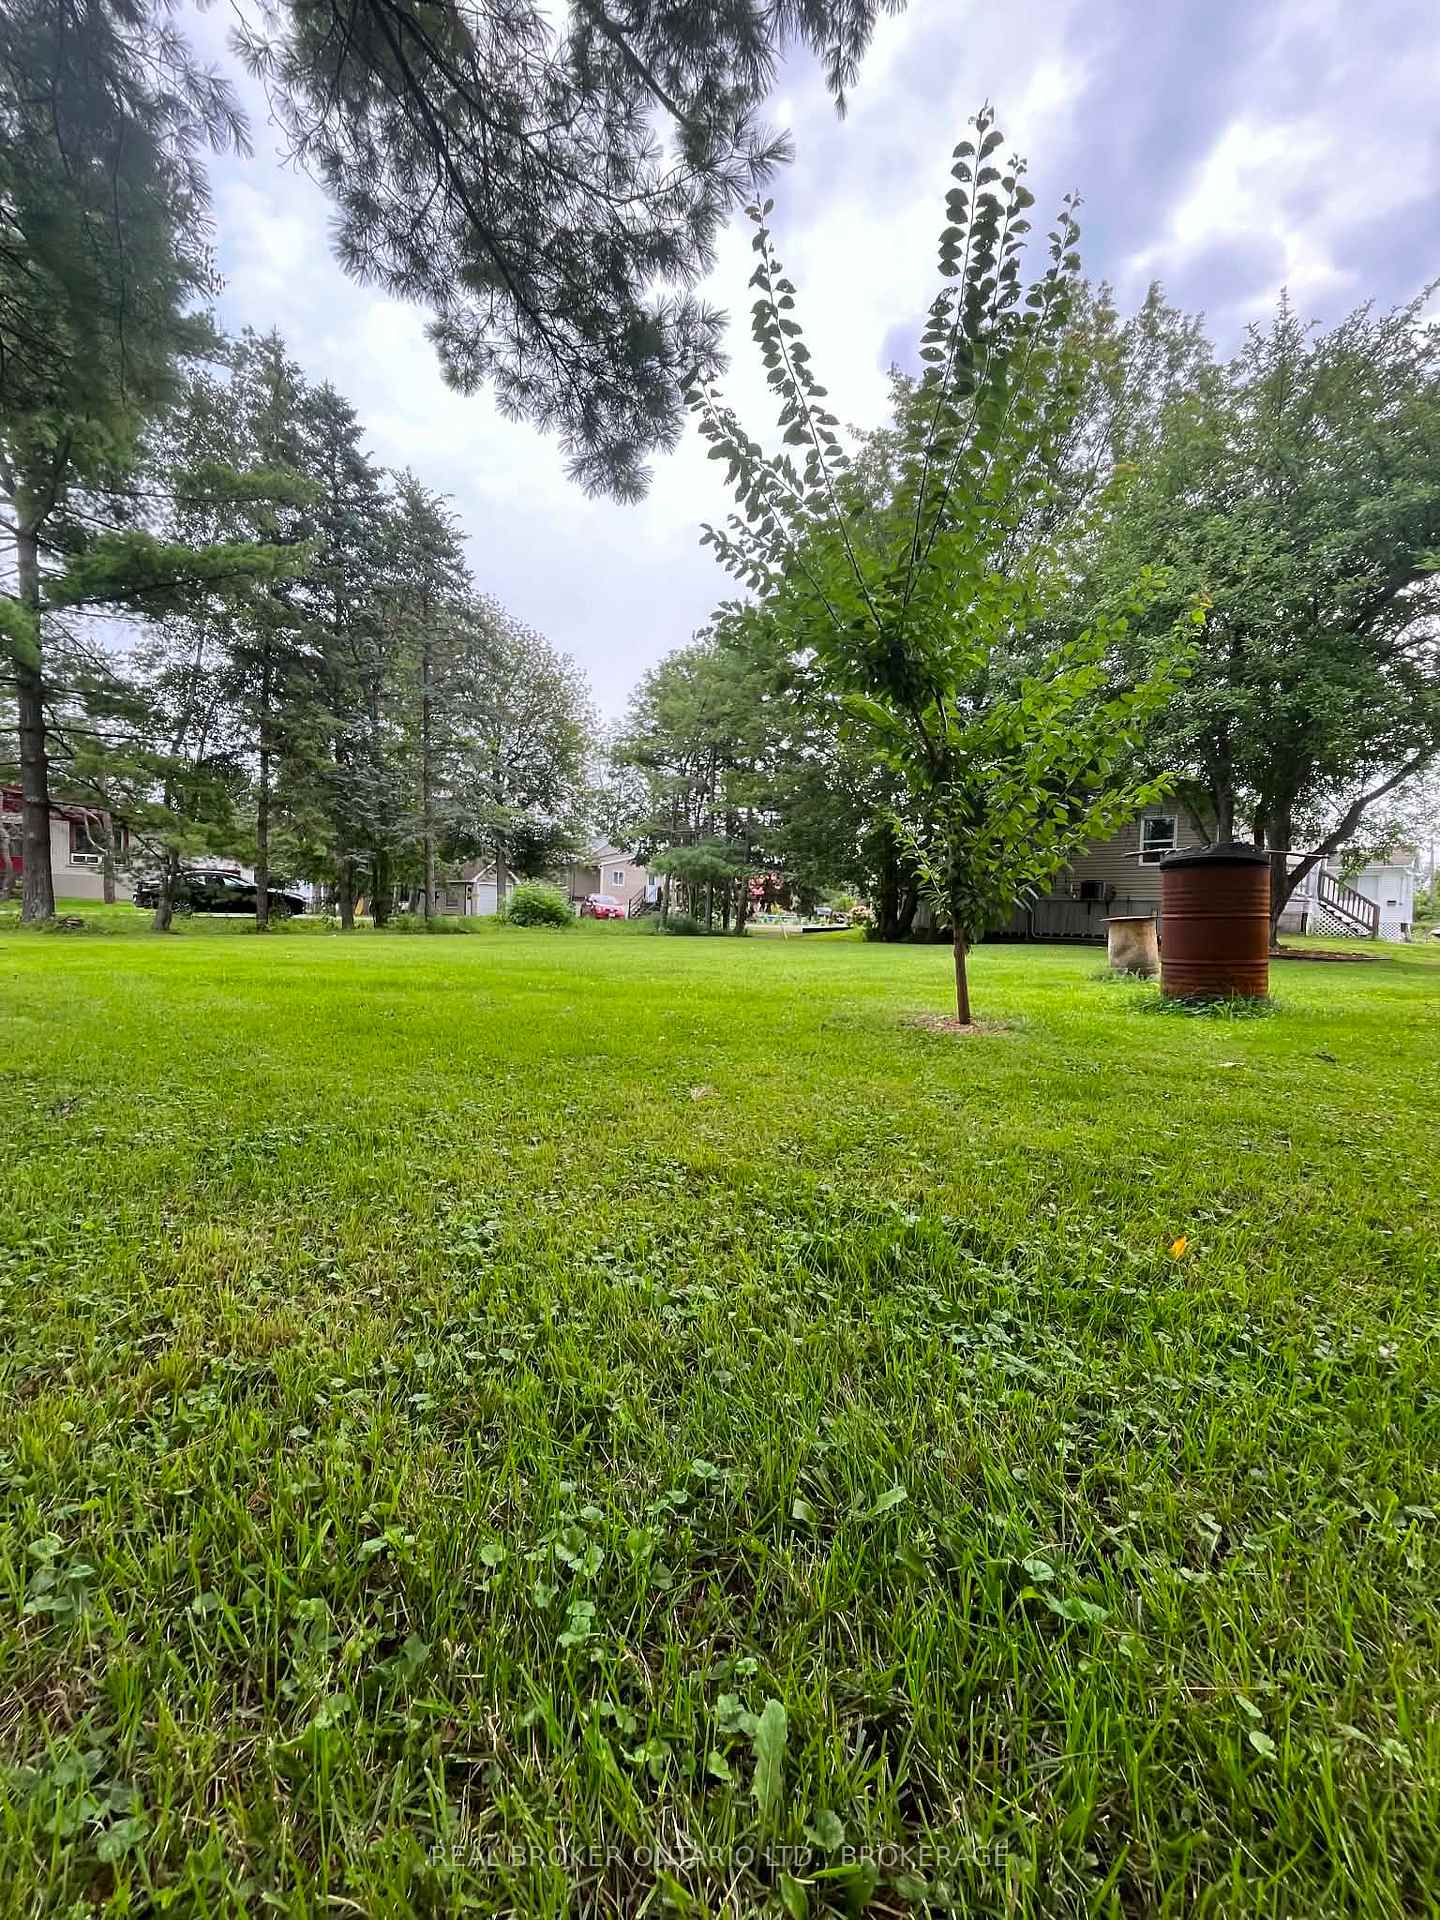
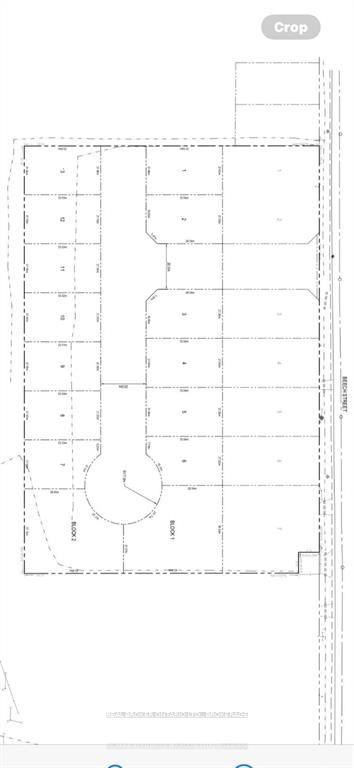
Listed 9 days ago
20314 Andrea Avenue
South Glengarry (Lancaster), ON K0C 2C0
DetachedFor Sale
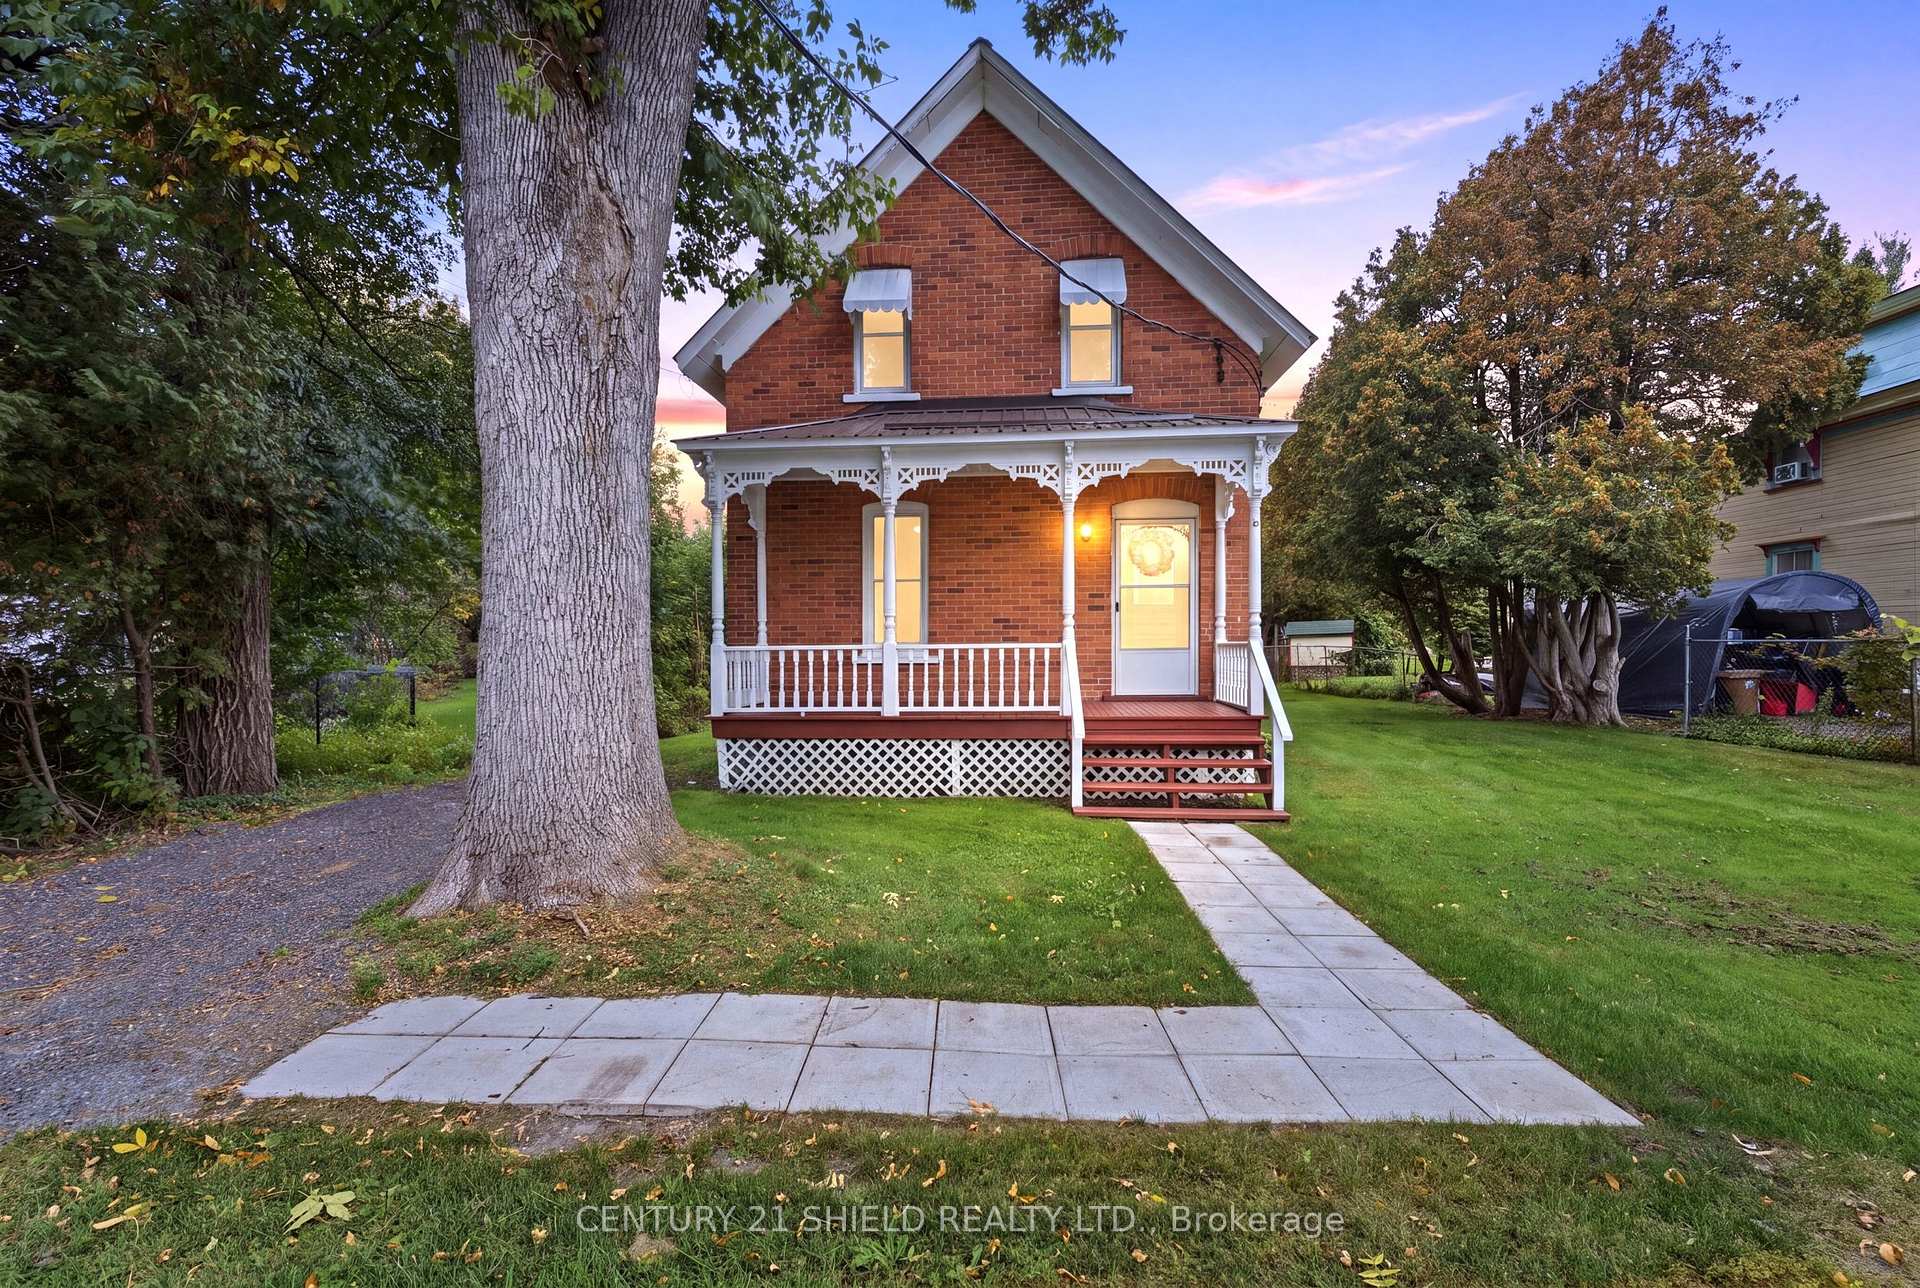
Listed 16 days ago
13 Oak Street
South Glengarry (Lancaster), ON K0C 1N0
DetachedFor Sale
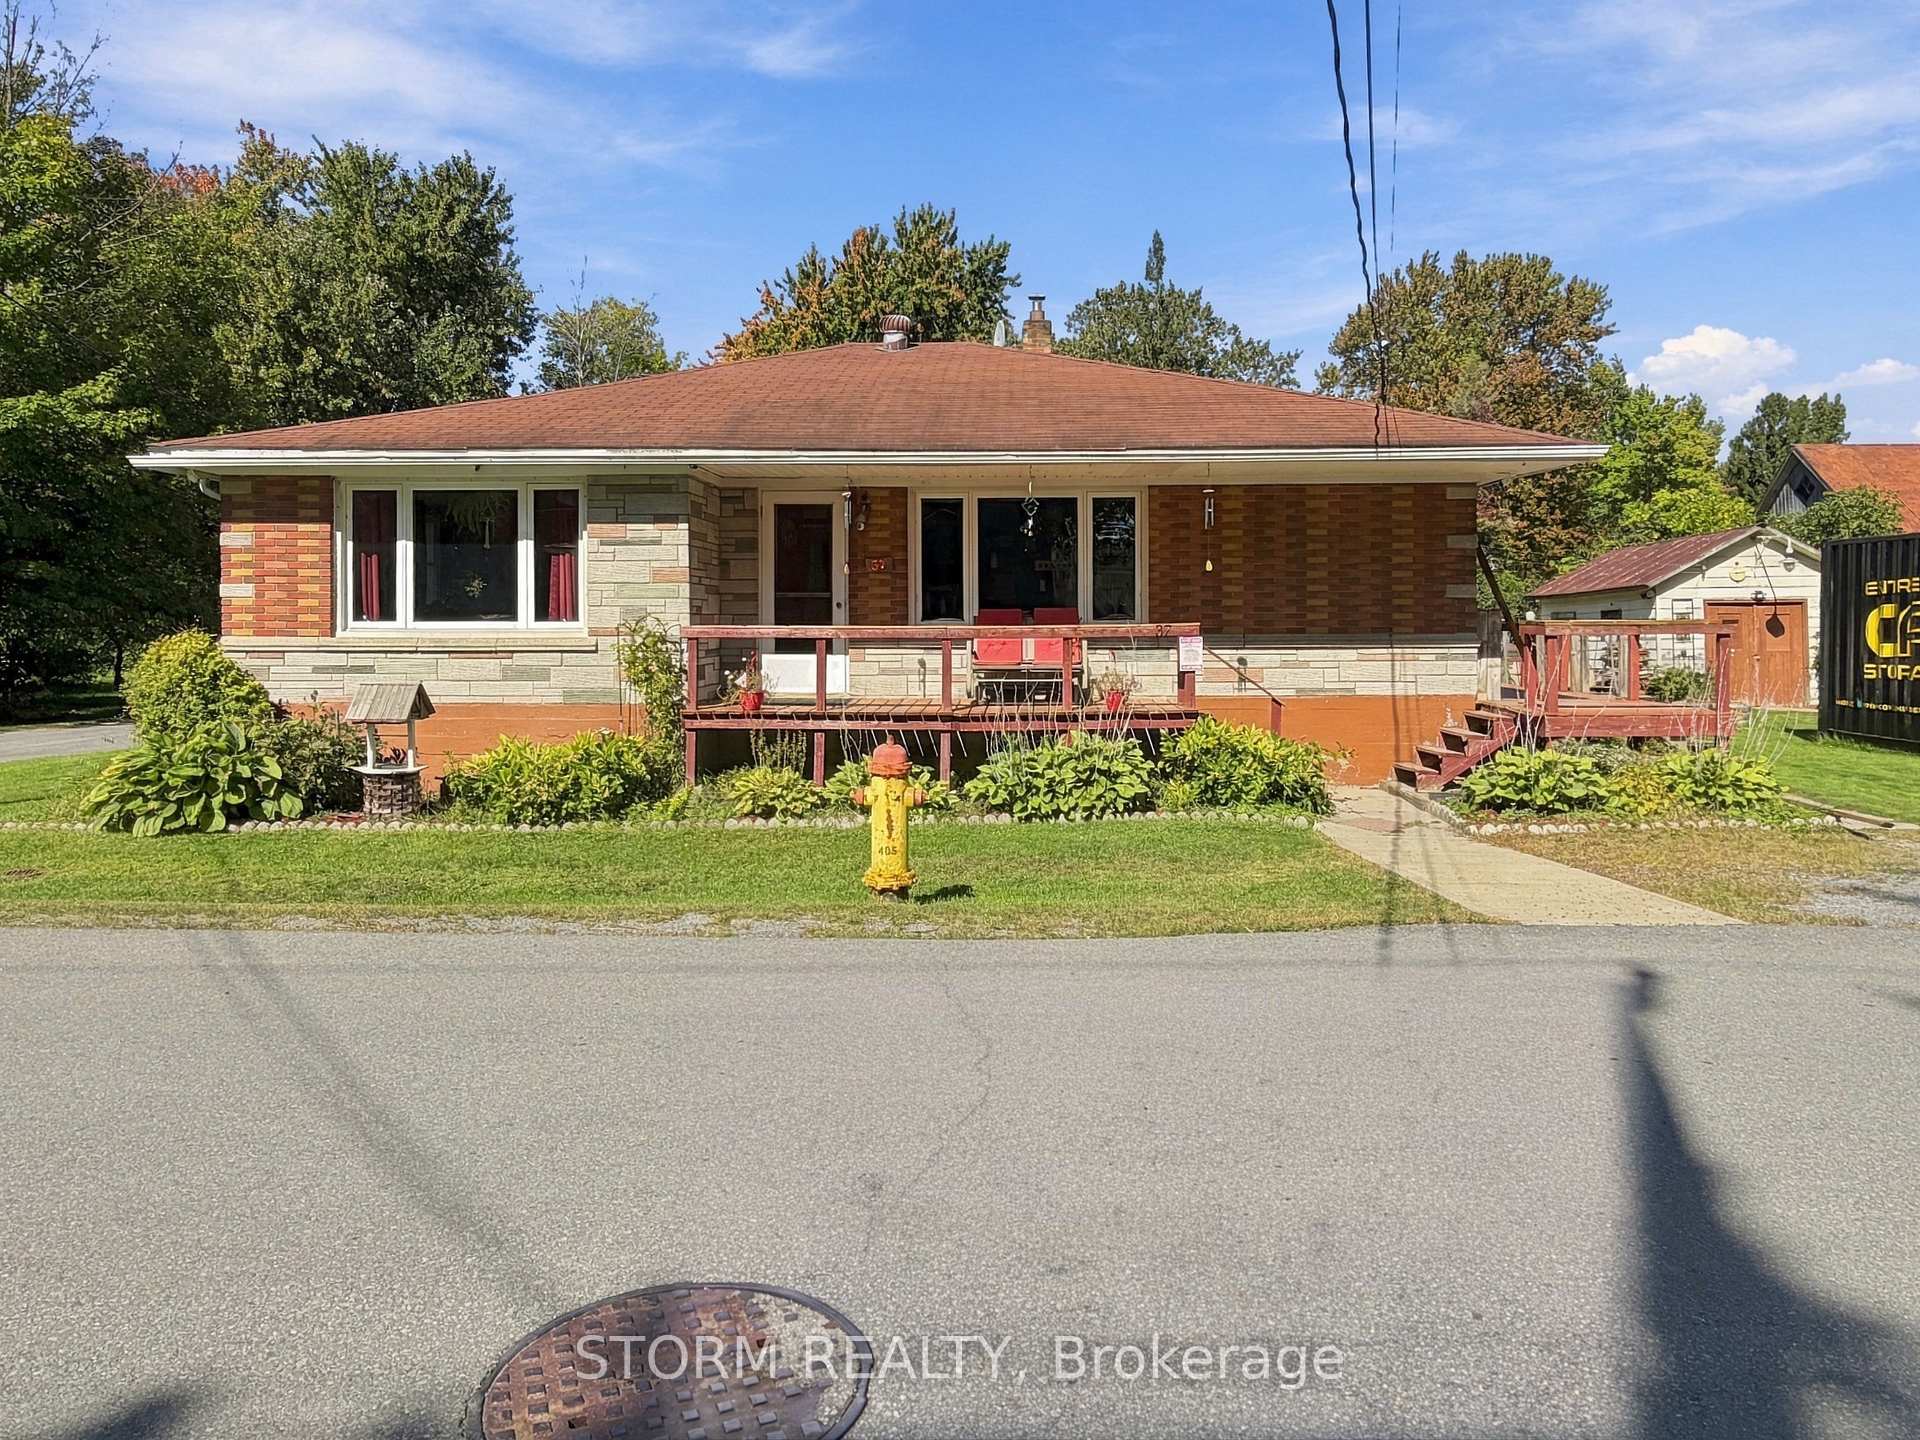
Listed 20 days ago
37 Oak Street
South Glengarry (Lancaster), ON K0C 1N0
DetachedFor Sale
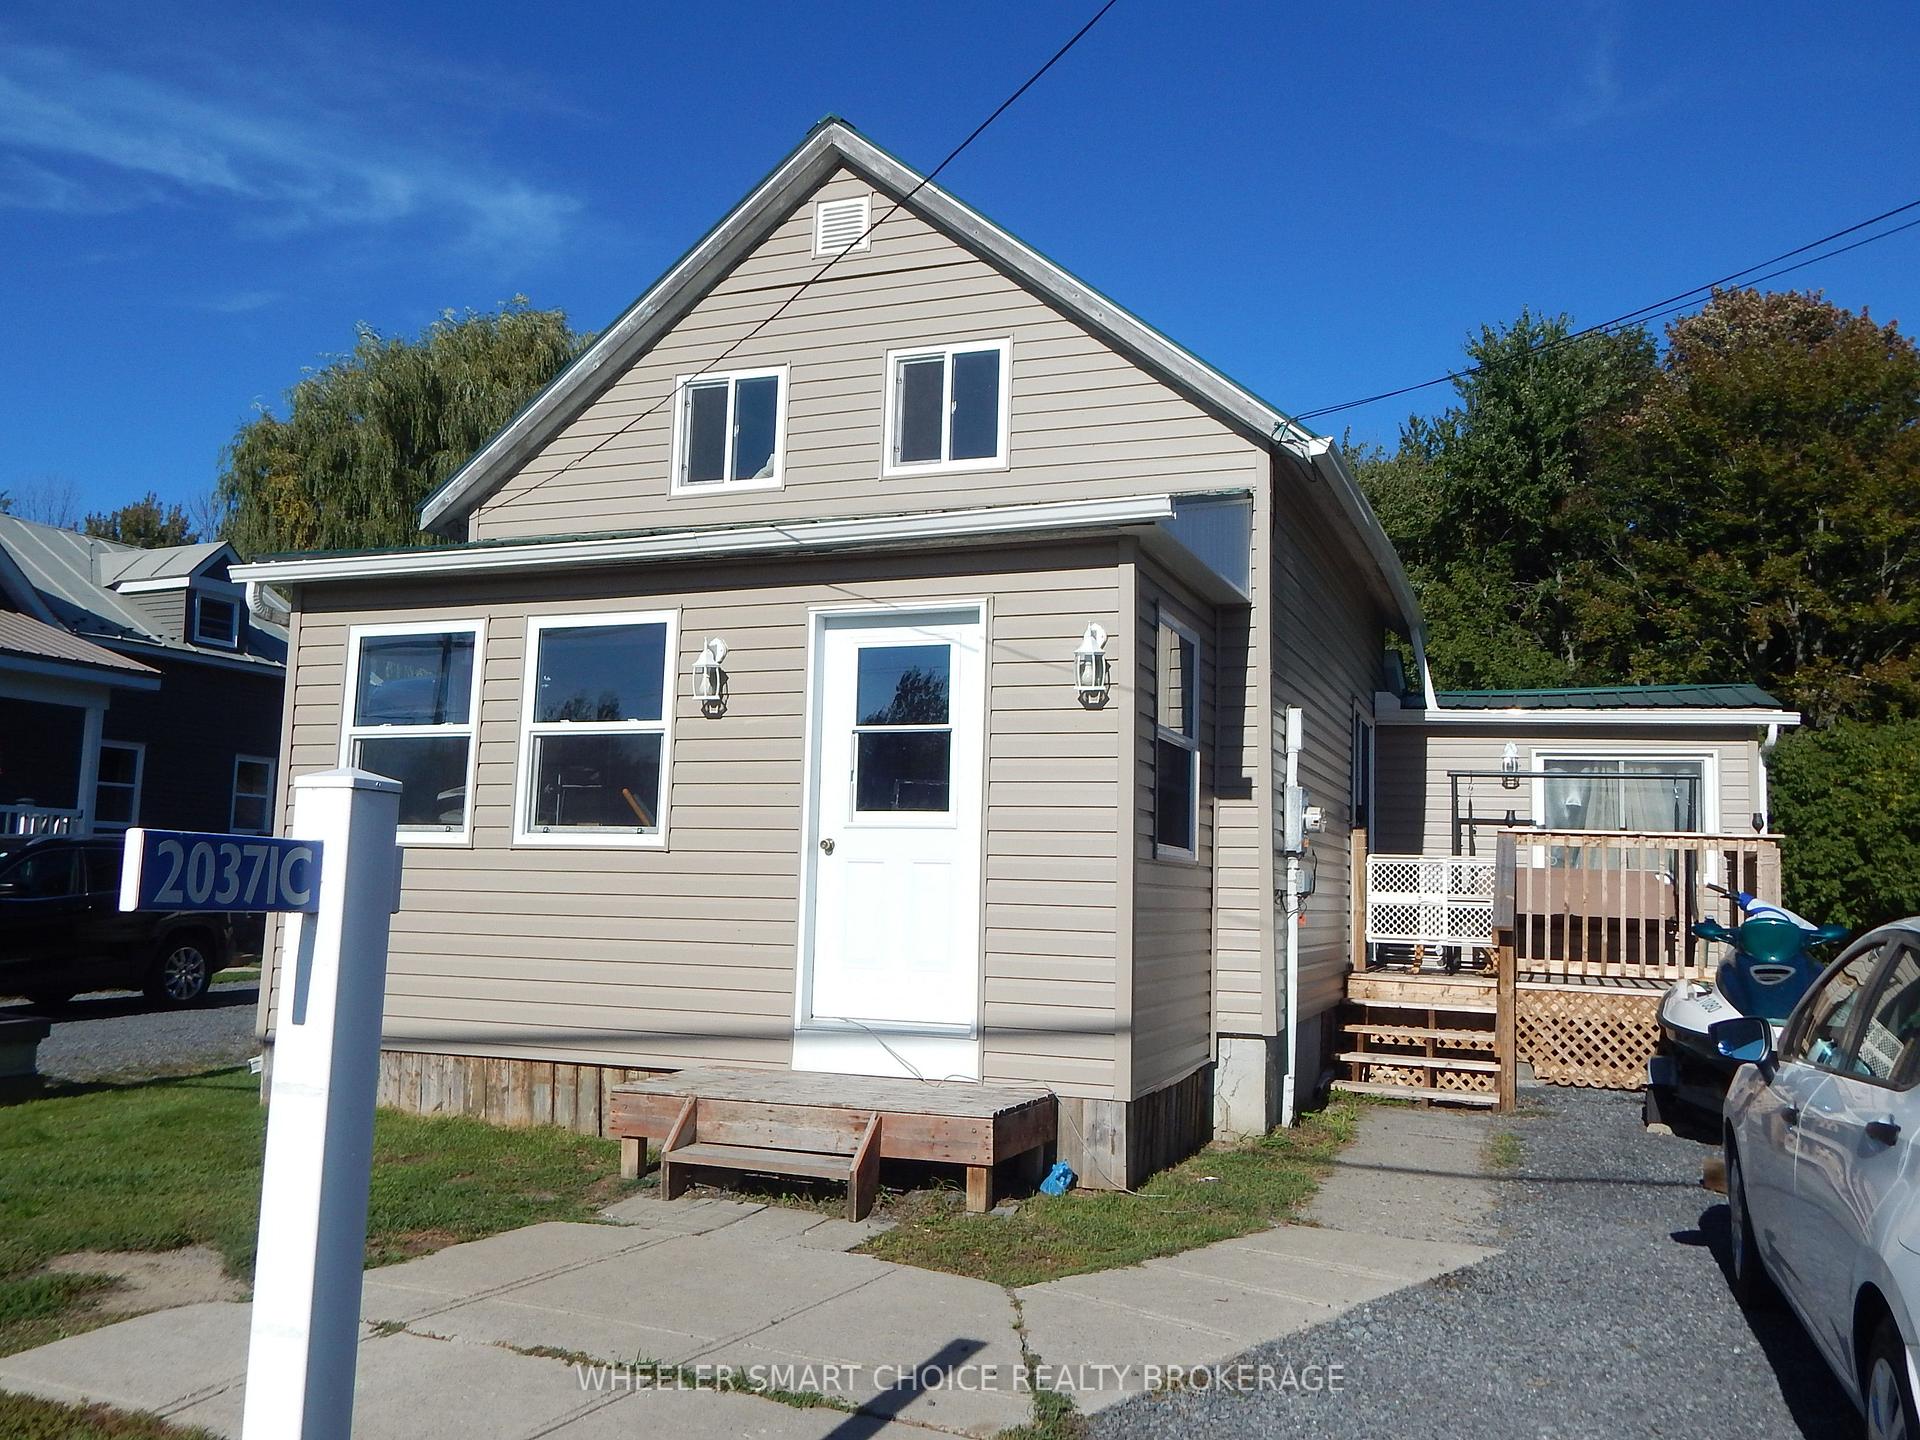
Listed 21 days ago
20371 County Rd 2
South Glengarry (Lancaster), ON K0C 2C0
DetachedFor Sale
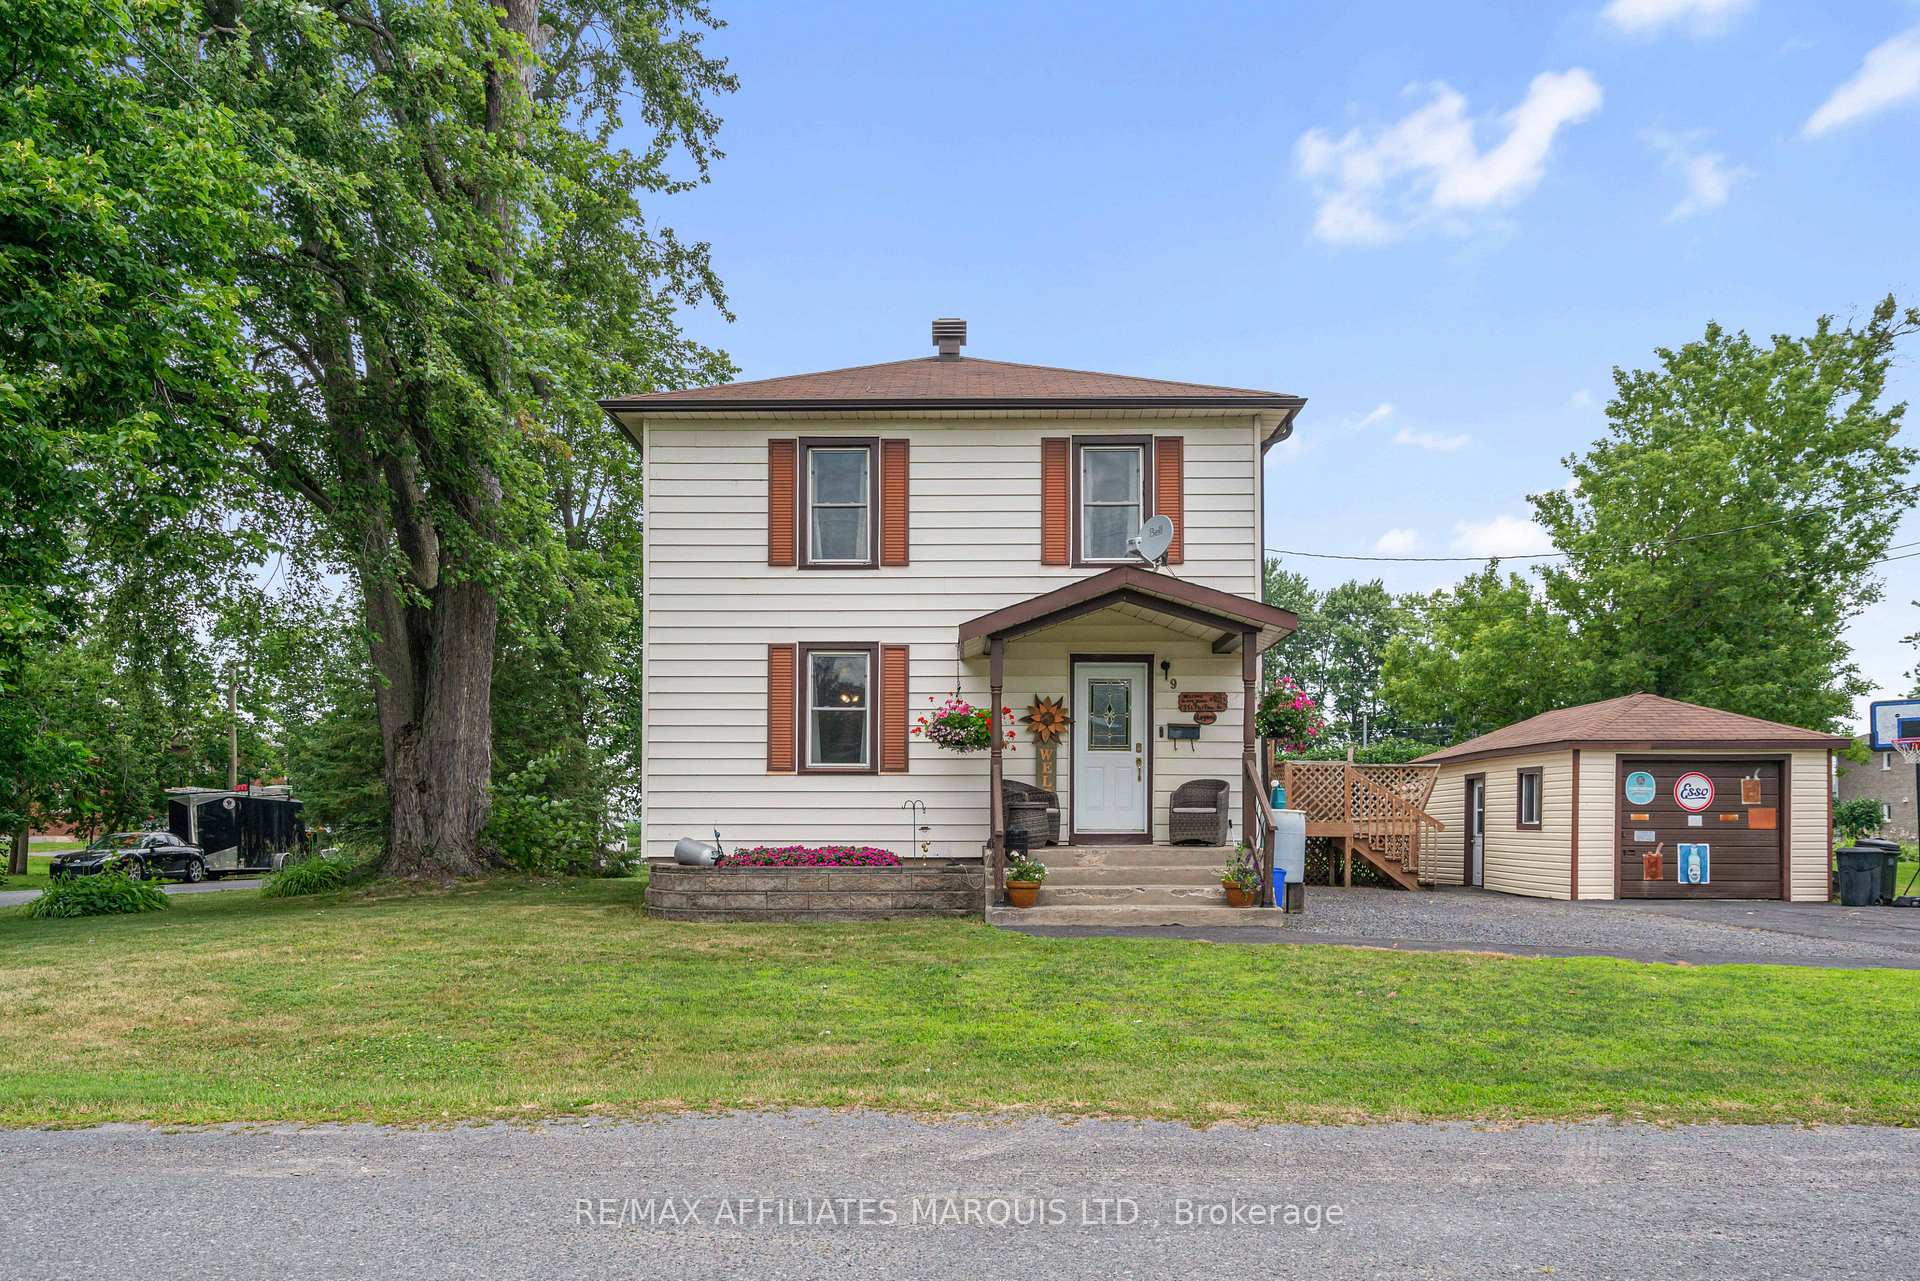
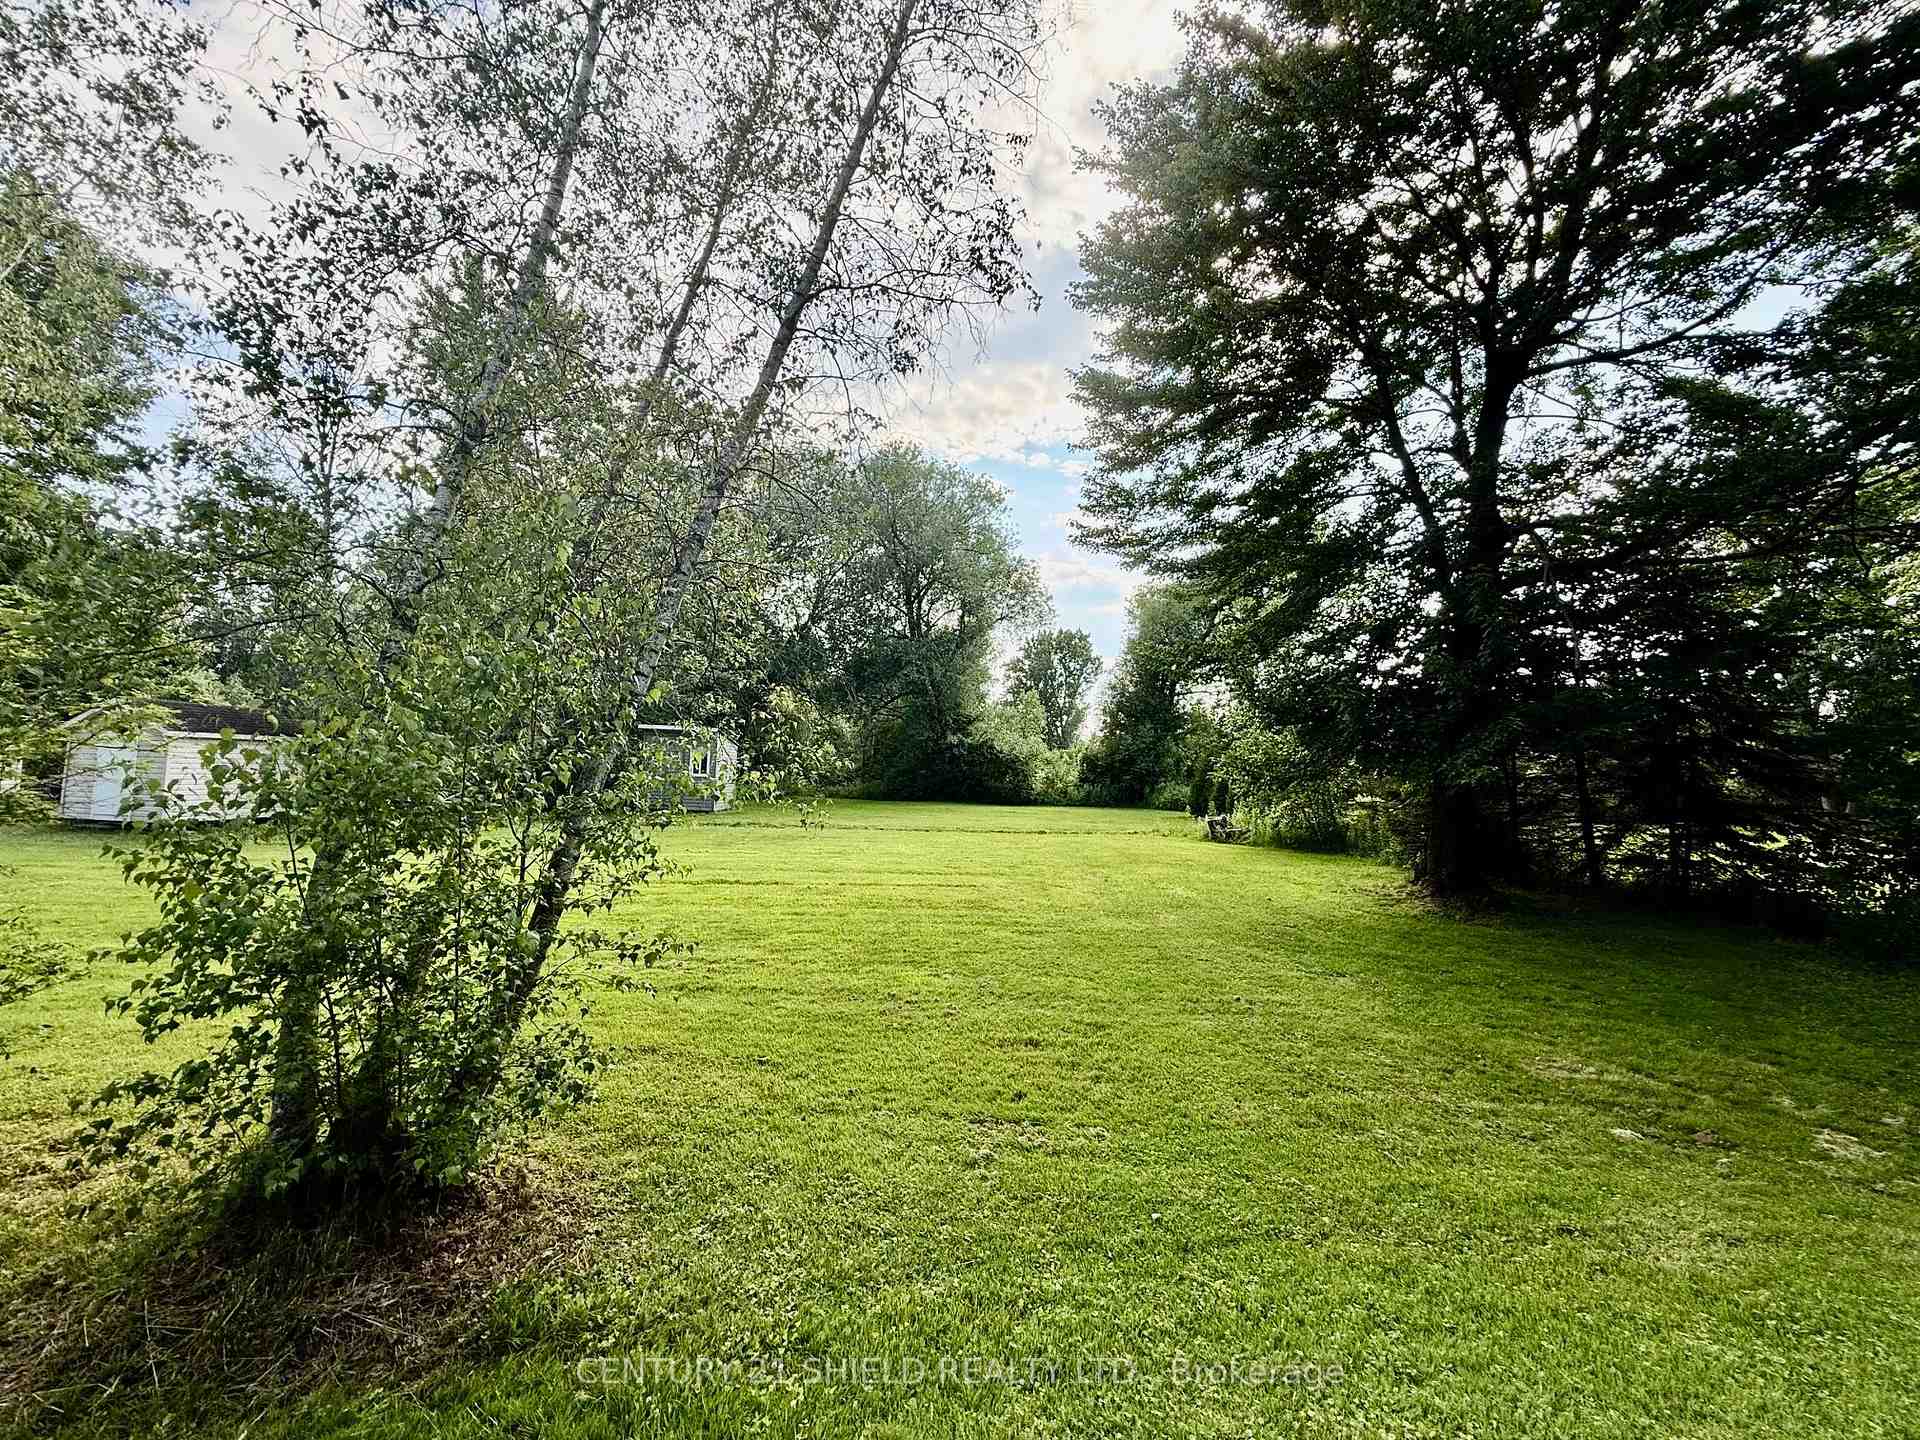
What it costsAffordability
Median asking price
$399,999
In Lancaster
$399,999
In South Glengarry
$550,000
In Ontario
$718,000
Median monthly rent
In South Glengarry
$2,500
In Ontario
$2,500
On the marketMarket snapshot
For sale
13
Median $399,999
Houses 13
For rent
0
Recently sold
Sign in to see sold data
Recently leased
Sign in to see leased data
Market data as of 2026-10-14. Sold and leased figures are neighbourhood medians over the last 12 months, published only where at least 5 homes closed — never a single sale.
The honest readPros & cons
What people love
- Lower median sale price than city average
- Community feel with local amenities
- Access to parks and playgrounds
Keep in mind
- Limited educational facilities
- No grocery stores or gyms available
The feel of the placeLifestyle
Residents enjoy a peaceful environment with essential services nearby. Daily life is relaxed and community-oriented.
Within the boundaryWhat's nearby
The boundary
12.6 km²
Every count and every census figure on this page was measured inside this line — not within a circle drawn around a centre point.
2
Parks
3
Playgrounds
4
Restaurants
1
Cafés
1
Libraries
1
Pharmacies
Counted across all 12.6 km² of Lancaster. From OpenStreetMap, as of 2026-10-12.
Sources: HOMEH listings, OpenStreetMap, Photo: © Mapbox © OpenStreetMap
What homes in Lancaster actually sell for
20 homes changed hands in Lancaster over the 12 months to September 2026. Half sold above $438,295 and half below, 6.6% higher than the 12 months before. A typical home found its buyer in 48 days — 2 days quicker than a year ago.
- Median sold price
- $438K
- +6.6% year over year
- Days to sell
- 48
- 2 days quicker
- Sales closed
- 20
- last 12 months
- Per square foot
- $319
- from 19 sized sales
Three years of sold prices
The line is the median. The band is the middle half of every sale — how wide it runs tells you how much one home here differs from the next.
What buyers actually paid
$967,800
on a $1,000,000 asking price — under ask by $32,200
- Of the asking price
- 96.8%
- Sold over asking
- 20%
From 20 sales that closed here in the last 12 months.
Every month behind these charts — Lancaster, sales
| Month | Closed | Median | Middle half | Days | % of ask |
|---|---|---|---|---|---|
| Sep 2026 | 1 | Not enough sales this month to report a median | |||
| Aug 2026 | 3 | Not enough sales this month to report a median | |||
| Jul 2026 | 1 | Not enough sales this month to report a median | |||
| Jun 2026 | 2 | Not enough sales this month to report a median | |||
| May 2026 | 2 | Not enough sales this month to report a median | |||
| Apr 2026 | 3 | Not enough sales this month to report a median | |||
| Mar 2026 | 2 | Not enough sales this month to report a median | |||
| Feb 2026 | 1 | Not enough sales this month to report a median | |||
| Nov 2025 | 3 | Not enough sales this month to report a median | |||
| Oct 2025 | 2 | Not enough sales this month to report a median | |||
| Sep 2025 | 1 | Not enough sales this month to report a median | |||
| Jun 2025 | 3 | Not enough sales this month to report a median | |||
| Apr 2025 | 4 | Not enough sales this month to report a median | |||
| Mar 2025 | 1 | Not enough sales this month to report a median | |||
| Feb 2025 | 1 | Not enough sales this month to report a median | |||
| Jan 2025 | 1 | Not enough sales this month to report a median | |||
| Dec 2024 | 2 | Not enough sales this month to report a median | |||
| Nov 2024 | 1 | Not enough sales this month to report a median | |||
| Oct 2024 | 2 | Not enough sales this month to report a median | |||
| Sep 2024 | 1 | Not enough sales this month to report a median | |||
| Aug 2024 | 2 | Not enough sales this month to report a median | |||
| Jul 2024 | 2 | Not enough sales this month to report a median | |||
| Jun 2024 | 1 | Not enough sales this month to report a median | |||
| Apr 2024 | 3 | Not enough sales this month to report a median | |||
| Jan 2024 | 1 | Not enough sales this month to report a median | |||
25 of these months closed fewer than 5 sales. A middle value taken over that few is not a market figure — with one sale it is simply that home's closing price — so the count is shown and the median is not. The sales themselves still count toward the 12-month figures above.
What people ask about Lancaster
How much does a home cost in Lancaster?
Homes in Lancaster sold for a median of $438,295 over the 12 months to September 2026, across 20 closed sales — half sold for more and half for less. That is 6.6% higher than the 12 months before it.
How long does it take to sell a home in Lancaster?
A home in Lancaster took a median of 48 days on the market over the 12 months to September 2026. Homes there closed at 96.8% of the asking price on average, with 20.0% selling over asking.
Compiled by HOMEH from sales reported closed in Lancaster on the Toronto Regional Real Estate Board MLS® System, through September 2026. Medians are taken over closed prices, not asking prices. Per-square-foot figures use the midpoint of the banded floor-area range MLS® carries, so they describe the group and not any one home. Not an appraisal or an opinion of value.