
Real Estate for Sale in Sherborne, Dorset, ON
Loading homes in Sherborne…
No listings match these filters in this area.
Try zooming out or widening your filters.
Neighbourhood in Dorset
Sherborne
Sherborne is a quiet neighbourhood in Dorset, Ontario. It currently has no homes for sale or rent.
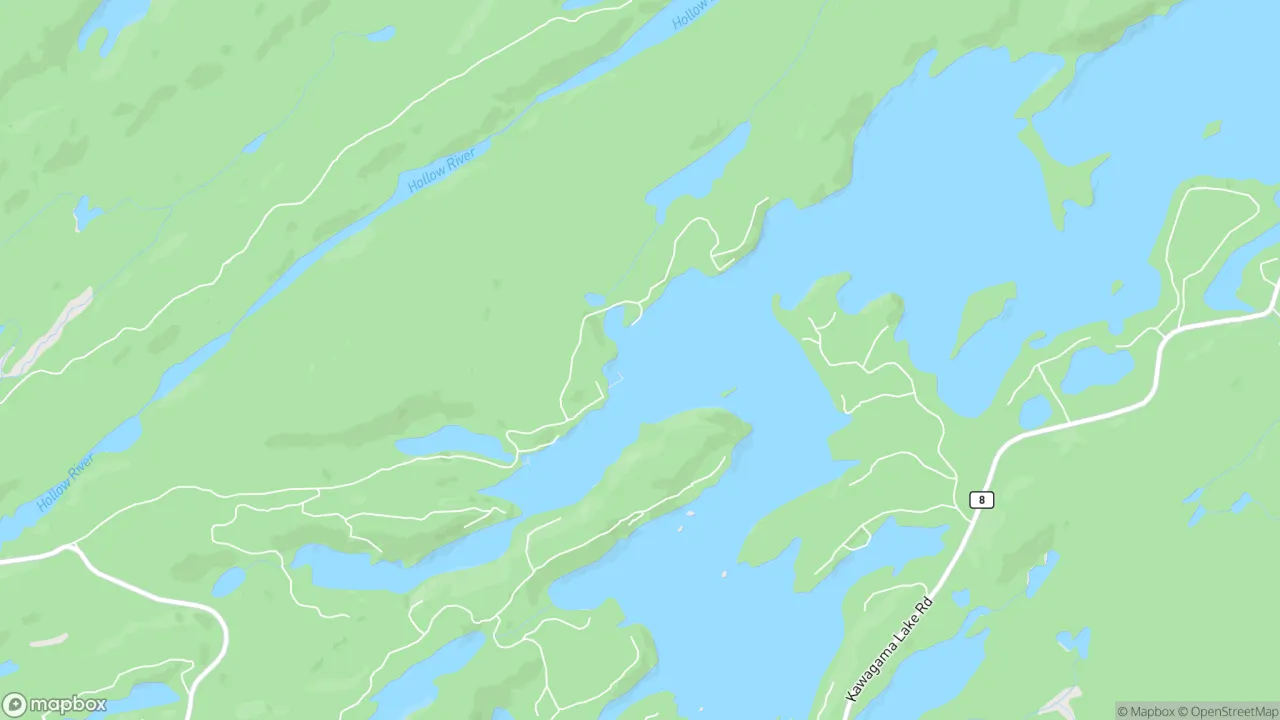
Dorset, Ontario
© Mapbox © OpenStreetMap
At a glance

What it costsAffordability
Median asking price
In Ontario
$716,900
Median monthly rent
In Ontario
$2,499
On the marketMarket snapshot
For sale
0
For rent
0
Recently sold
Sign in to see sold data
Recently leased
Sign in to see leased data
Market data as of 2026-08-16. Sold and leased figures are neighbourhood medians over the last 12 months, published only where at least 5 homes closed — never a single sale.
The honest readPros & cons
What people love
- Peaceful living environment
- Low population density
- Potential for future development
Keep in mind
- Lack of amenities and services
- No public transportation available
The feel of the placeLifestyle
Daily life in Sherborne is very calm due to its quiet nature. Residents may need to travel to nearby areas for services.
The areaWhat's nearby
Not enough verified data yet. We count schools, parks, transit and shops inside Sherborne's real boundary and publish the numbers only once that count is confirmed — an estimate here would be worse than nothing.
The peopleWho lives here
1,010
Population (2021)
920.6 km²
Area
1
People per km²
60.8
Median age
$75,000
Median income
88%
Own their home
1.9
People per household
485
Households
Every age
- Children (under 15)5.4%
- Working age (15–64)57.1%
- Seniors (65+)37.4%
What is built here
- Detached houses97.1%
- Semi-detached1%
- Duplexes1%
- Other attached homes1%
Own or rent
88%Owners
13%Renters
Across 485 households
When it was built
Mostly 1961–1980
- 1960 or earlier22%
- 1961–198027%
- 1981–199020%
- 1991–20009%
- 2001–20054%
- 2006–20108%
- 2011–20155%
- 2016–20215%
Share of occupied homes, by the era they were built in. Bars are drawn against the busiest era, not against each other, because the eras are not the same length. The eight shares are unlikely to total exactly 100: Statistics Canada rounds each era's count to the nearest 5 before publishing it, so we print what the census reports rather than adjusting a figure to make the column add up.
- 6.6%
- Born outside Canada
- 23.5%
- Hold a degree or higher
- 38.5%
- Employment rate
- 0%
- Commute by transit
- 91.5%
- Commute by car
- 1.4
- Children per family
- $66,500
- Median income after tax
- $99,600
- Average household income
- 11.2%
- Living on a low income
- $800/mo
- Renters pay, per month
- $745/mo
- Owners pay, per month
- $532,000
- Median home value at census
- 38.5%
- Renters spending 30%+ of income on housing
- 15.5%
- Owners spending 30%+ of income on housing
Statistics Canada, Census of Population 2021. Added up from 1 census area around the listings we hold here. Medians and rates are a population-weighted average of dissemination-area figures.
Sources: HOMEH listings, Statistics Canada, Census of Population 2021, OpenStreetMap, © OpenStreetMap contributors (ODbL), Photo: © Mapbox © OpenStreetMap