
Real Estate for Sale in Sunninghill, Hamilton, ON
Loading homes in Sunninghill…
No listings match these filters in this area.
Try zooming out or widening your filters.
Neighbourhood in Hamilton
Sunninghill
Sunninghill is a quiet neighbourhood in Hamilton, Ontario. It offers a mix of residential homes and local amenities.
At a glance
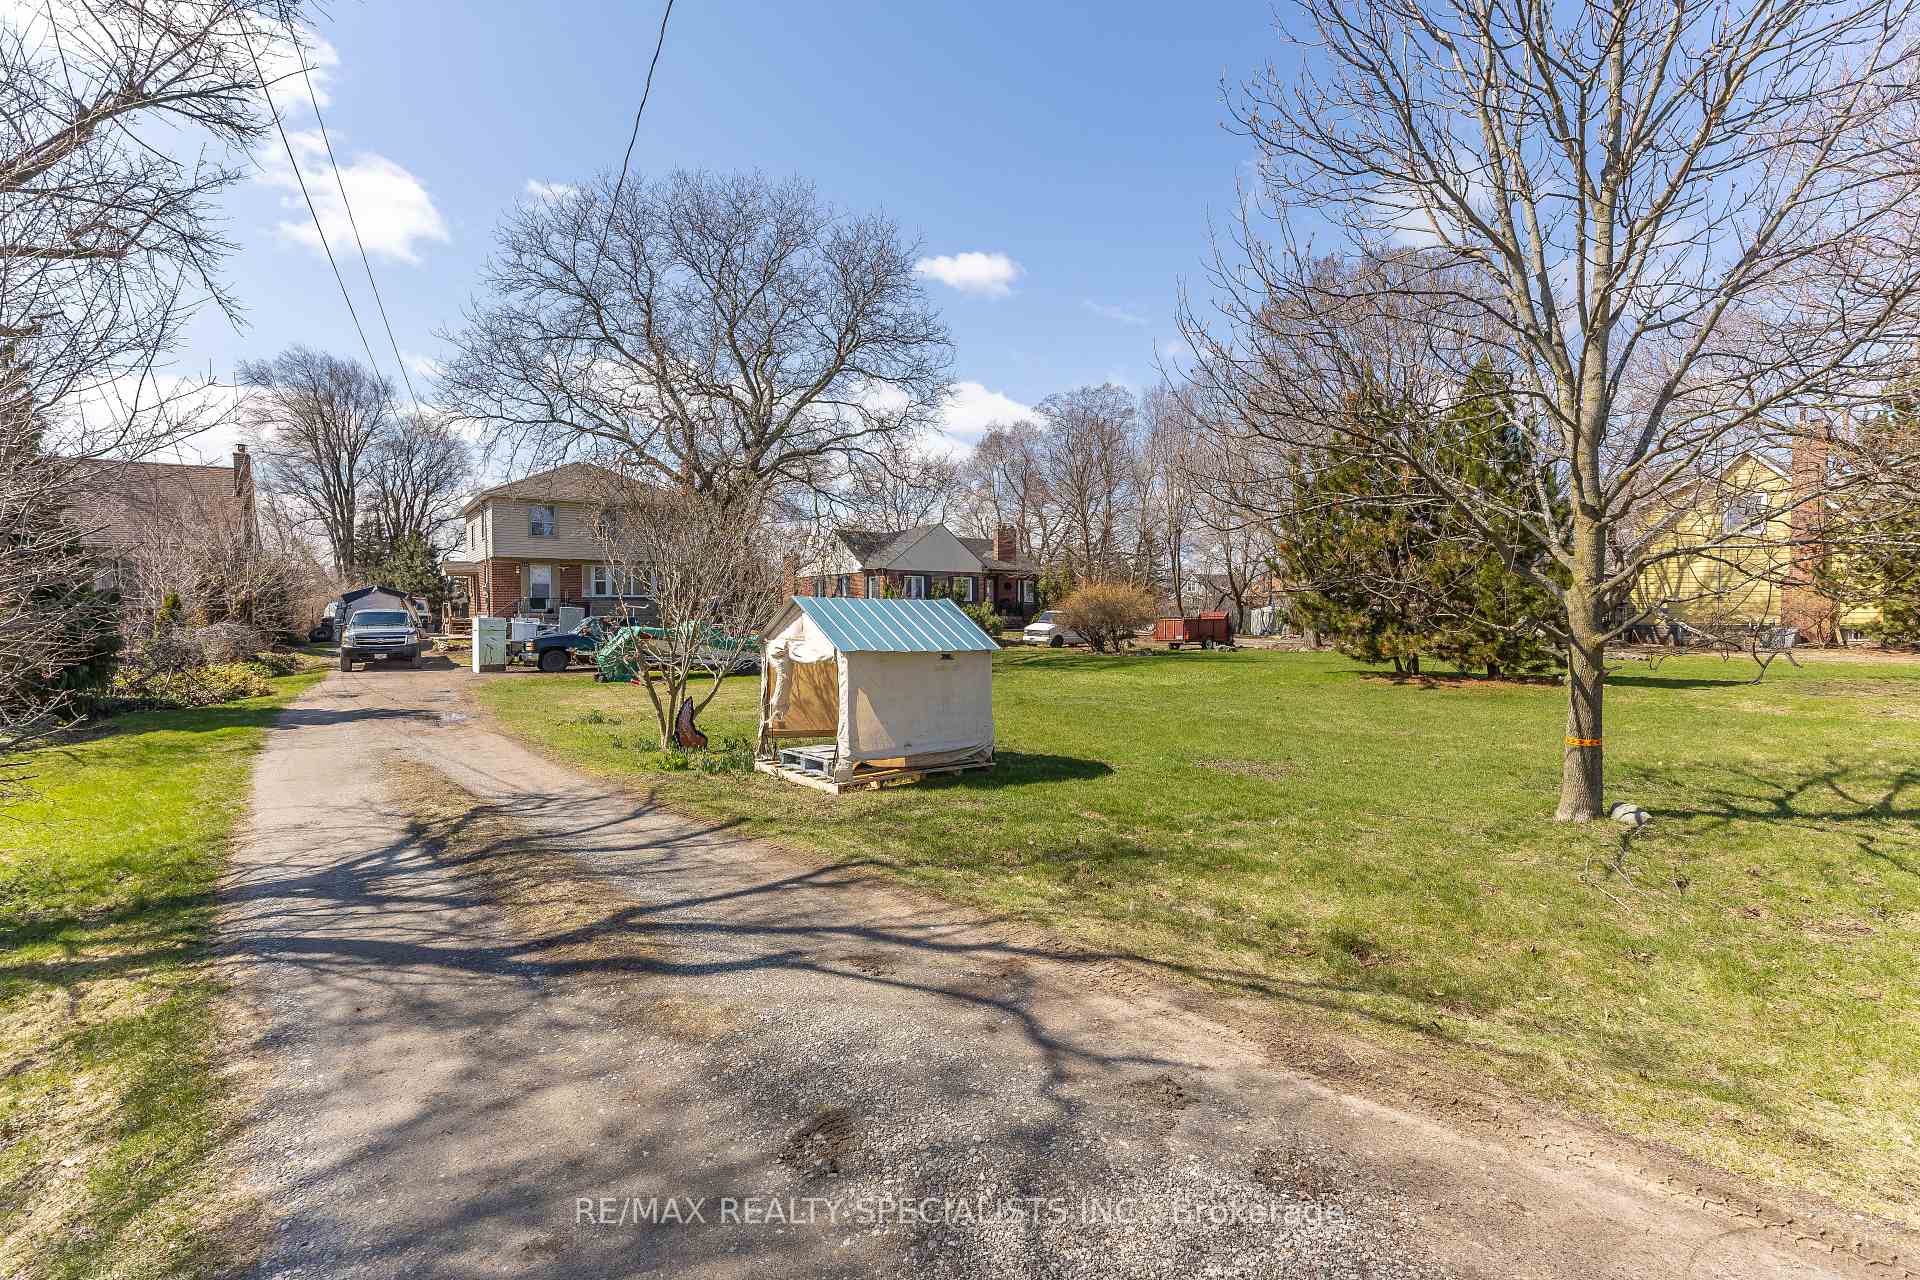
Listed 1 day ago
970 Concession Street
Hamilton (Sunninghill), ON L8T 1A1
DetachedFor Sale
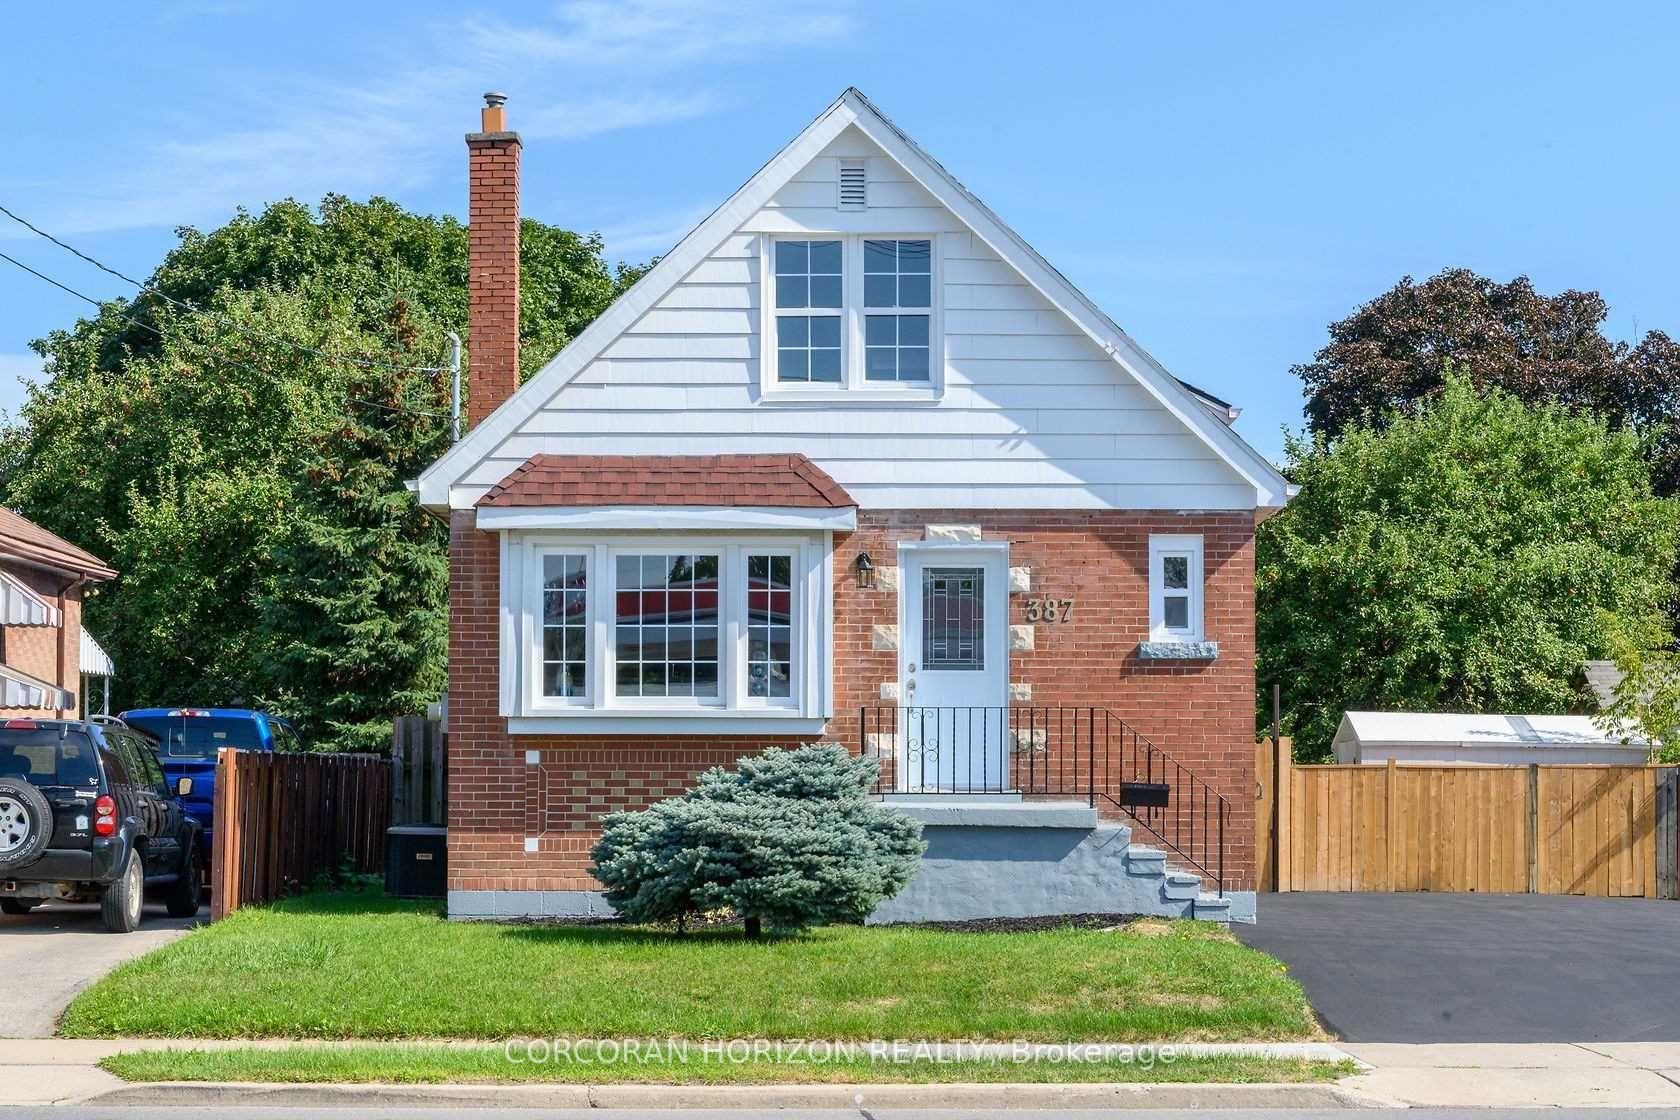
Listed 20 days ago
387 Upper Gage Avenue
Hamilton (Sunninghill), ON L8K 4X9
DetachedFor Sale
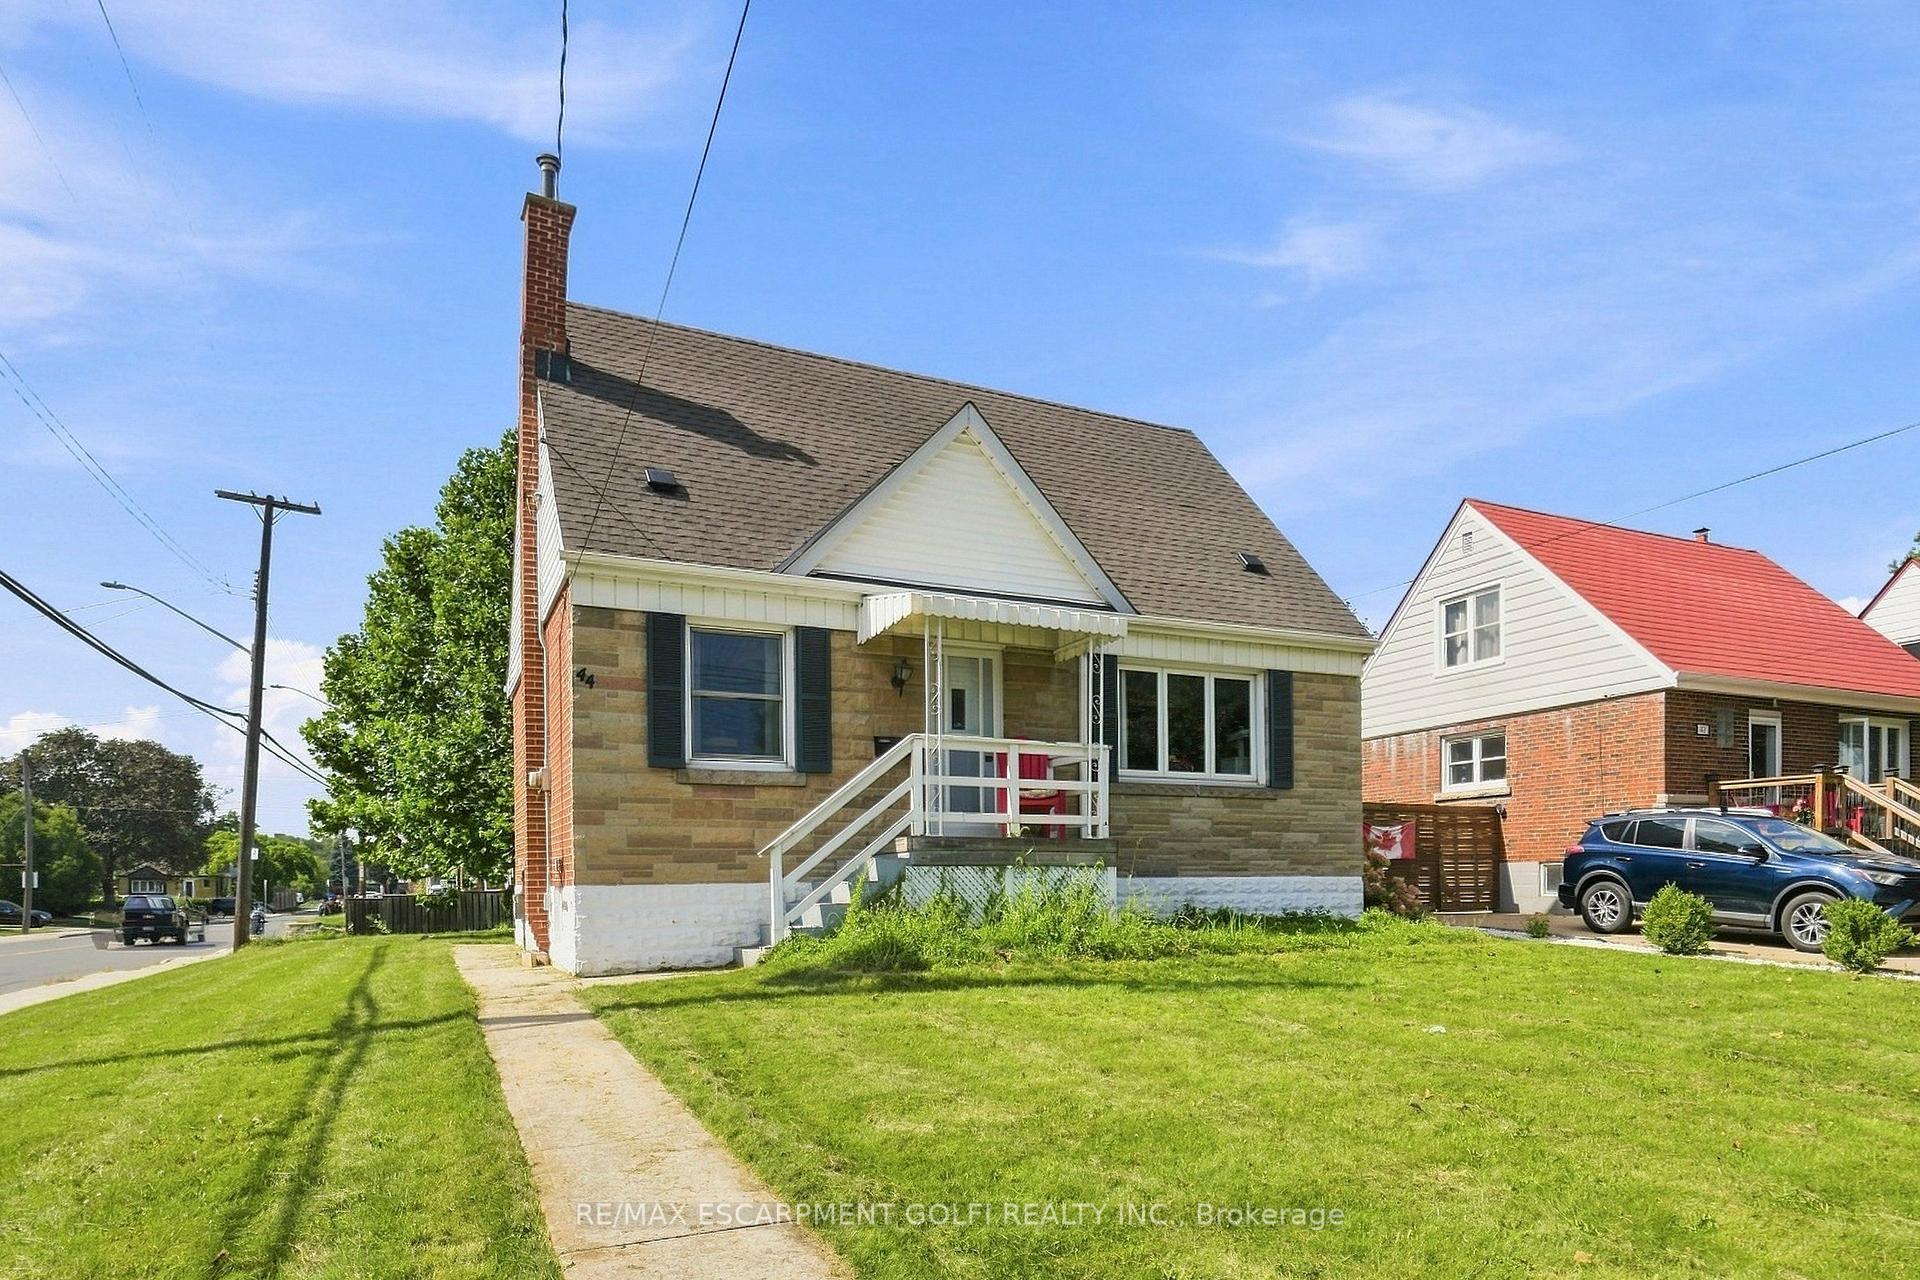
Listed Sep 10, 2026
44 Green Meadow Road
Hamilton (Sunninghill), ON L8T 3J5
DetachedFor Sale
Day to dayLivability
4.6
Schools near listings
out of 10 · averaged over 457 past and present listings
Fraser Institute ratings within 2 km of each listing, closer schools weighted more
Each score is an average over this area's own listings and is shown only where at least 5 of them carry one. Scores are reported by listing agents, not measured by HOMEH.
What it costsAffordability
Median asking price
$649,000
In Sunninghill
$649,000
In Hamilton
$724,900
In Ontario
$719,900
Median monthly rent
$1,850/mo
In Sunninghill
$1,850
In Hamilton
$2,100
In Ontario
$2,500
≈ 29.2 years
Of rent to match the purchase price
On the marketMarket snapshot
For sale
5
Median $649,000
Houses 5
For rent
3
Median $1,850
Houses 3
Recently sold
Sign in to see sold data
Recently leased
Sign in to see leased data
Market data as of 2026-10-07. Sold and leased figures are neighbourhood medians over the last 12 months, published only where at least 5 homes closed — never a single sale.
The honest readPros & cons
What people love
- Affordable housing compared to Hamilton median
- Strong community with low crime rates
- Good access to local schools
- High ownership rate at 82.8%
Keep in mind
- Limited public transit options
- Few entertainment and dining choices
The feel of the placeLifestyle
Residents enjoy a peaceful environment with family-oriented amenities. Daily life is relaxed with a focus on community.
Within the boundaryWhat's nearby
The boundary
0.8 km²
Every count and every census figure on this page was measured inside this line — not within a circle drawn around a centre point.
2
Parks
2
Playgrounds
1
Grocery stores
2
Restaurants
1
Cafés
1
Gyms
1
Pharmacies
Counted across all 0.8 km² of Sunninghill. From OpenStreetMap, as of 2026-10-12.
The schoolsWhich schools, and how they rate
3.8/10
Average rating of the 1 rated school in this area
1
Elementary
Highview Public School
Public · Grades JK–8 · Hamilton-Wentworth DSB
3.8/103.7 over 5 yrs2,642nd of 3,045 Ontario elementary schools
550 students · EQAO 2024-2025
Ontario Ministry of Education school registry; ratings from the Fraser Institute report card. These are the schools that stand inside Sunninghill, not a catchment — most Ontario boards do not publish attendance boundaries, and we will not draw a line we cannot source. Confirm enrolment with the school board before you buy.
The peopleWho lives here
2,352
Population (2021)
0.8 km²
Area
2,831
People per km²
44.3
Median age
$93,129
Median income
83%
Own their home
2.5
People per household
930
Households
Every age
- Children (under 15)14.3%
- Working age (15–64)65.9%
- Seniors (65+)19.8%
What is built here
- Detached houses91%
- Duplexes2.1%
- Low-rise apartments1.1%
- High-rise apartments5.3%
Own or rent
83%Owners
17%Renters
Across 930 households
When it was built
Mostly 1960 or earlier
- 1960 or earlier75%
- 1961–198019%
- 1981–19900%
- 1991–20003%
- 2001–20051%
- 2006–20100%
- 2011–20150%
- 2016–20210%
Share of occupied homes, by the era they were built in. Bars are drawn against the busiest era, not against each other, because the eras are not the same length. The eight shares are unlikely to total exactly 100: Statistics Canada rounds each era's count to the nearest 5 before publishing it, so we print what the census reports rather than adjusting a figure to make the column add up.
- 18%
- Born outside Canada
- 16.8%
- Hold a degree or higher
- 52%
- Employment rate
- 5.9%
- Commute by transit
- 88.8%
- Commute by car
- 1.7
- Children per family
- $81,435
- Median income after tax
- $102,520
- Average household income
- 6.6%
- Living on a low income
- $1,440/mo
- Renters pay, per month
- $1,321/mo
- Owners pay, per month
- $614,880
- Median home value at census
- 20.9%
- Renters spending 30%+ of income on housing
- 8.3%
- Owners spending 30%+ of income on housing
Statistics Canada, Census of Population 2021. Added up from 4 census areas inside the boundary. Medians and rates are a population-weighted average of dissemination-area figures.
Sources: HOMEH listings, Statistics Canada, Census of Population 2021, OpenStreetMap, HOMEH school registry
What homes in Sunninghill actually sell for
27 homes changed hands in Sunninghill over the 12 months to September 2026. Half sold above $688,043 and half below, 0.5% lower than the 12 months before. A typical home found its buyer in 25 days — 4 days quicker than a year ago.
- Median sold price
- $688K
- -0.5% year over year
- Days to sell
- 25
- 4 days quicker
- Sales closed
- 27
- last 12 months
- Per square foot
- $627
- from 27 sized sales
Three years of sold prices
The line is the median. The band is the middle half of every sale — how wide it runs tells you how much one home here differs from the next.
What buyers actually paid
$971,300
on a $1,000,000 asking price — under ask by $28,700
- Of the asking price
- 97.1%
- Sold over asking
- 14.8%
From 27 sales that closed here in the last 12 months.
Rent or buy in Sunninghill
27.1 years
of rent, at the going rate here, adds up to what a home here costs.
Median sold price
$688,043
27 sales
Median rent
$2,117/mo
15 leases
Gross rental yield
3.69%
before costs
Both figures come from deals that actually closed in Sunninghill over the last 12 months. Gross yield is annual rent divided by price; it does not account for taxes, fees, maintenance, vacancy or financing.
Every month behind these charts — Sunninghill, sales
| Month | Closed | Median | Middle half | Days | % of ask |
|---|---|---|---|---|---|
| Sep 2026 | 3 | Not enough sales this month to report a median | |||
| Aug 2026 | 1 | Not enough sales this month to report a median | |||
| Jul 2026 | 1 | Not enough sales this month to report a median | |||
| Jun 2026 | 3 | Not enough sales this month to report a median | |||
| May 2026 | 3 | Not enough sales this month to report a median | |||
| Apr 2026 | 3 | Not enough sales this month to report a median | |||
| Mar 2026 | 2 | Not enough sales this month to report a median | |||
| Feb 2026 | 3 | Not enough sales this month to report a median | |||
| Jan 2026 | 2 | Not enough sales this month to report a median | |||
| Dec 2025 | 2 | Not enough sales this month to report a median | |||
| Nov 2025 | 1 | Not enough sales this month to report a median | |||
| Oct 2025 | 3 | Not enough sales this month to report a median | |||
| Sep 2025 | 4 | Not enough sales this month to report a median | |||
| Jun 2025 | 2 | Not enough sales this month to report a median | |||
| May 2025 | 2 | Not enough sales this month to report a median | |||
| Mar 2025 | 2 | Not enough sales this month to report a median | |||
| Feb 2025 | 1 | Not enough sales this month to report a median | |||
| Jan 2025 | 5 | $650,000 | $649K – $799K | 58 | 97.0% |
| Nov 2024 | 2 | Not enough sales this month to report a median | |||
| Sep 2024 | 3 | Not enough sales this month to report a median | |||
| Jul 2024 | 2 | Not enough sales this month to report a median | |||
| Jun 2024 | 6 | $741,000 | $685K – $798K | 17 | 98.7% |
| May 2024 | 3 | Not enough sales this month to report a median | |||
| Apr 2024 | 1 | Not enough sales this month to report a median | |||
| Mar 2024 | 4 | Not enough sales this month to report a median | |||
| Feb 2024 | 1 | Not enough sales this month to report a median | |||
| Jan 2024 | 5 | $715,000 | $677K – $720K | 24 | 100.0% |
| Dec 2023 | 3 | Not enough sales this month to report a median | |||
| Nov 2023 | 1 | Not enough sales this month to report a median | |||
| Oct 2023 | 2 | Not enough sales this month to report a median | |||
27 of these months closed fewer than 5 sales. A middle value taken over that few is not a market figure — with one sale it is simply that home's closing price — so the count is shown and the median is not. The sales themselves still count toward the 12-month figures above.
What people ask about Sunninghill
How much does a home cost in Sunninghill?
Homes in Sunninghill sold for a median of $688,043 over the 12 months to September 2026, across 27 closed sales — half sold for more and half for less. That is 0.5% lower than the 12 months before it.
How long does it take to sell a home in Sunninghill?
A home in Sunninghill took a median of 25 days on the market over the 12 months to September 2026. Homes there closed at 97.1% of the asking price on average, with 14.8% selling over asking.
How much is rent in Sunninghill?
The median lease in Sunninghill closed at $2,117 a month over the 12 months to September 2026, across 15 leases.
Is it cheaper to rent or buy in Sunninghill?
A home in Sunninghill costs about 27.1 years of the rent on one — the median price of $688,043 against a median rent of $2,117 a month, a gross yield of 3.69%. The shorter that number, the closer buying is to renting before financing costs.
Compiled by HOMEH from sales reported closed in Sunninghill on the Toronto Regional Real Estate Board MLS® System, through September 2026. Medians are taken over closed prices, not asking prices. Per-square-foot figures use the midpoint of the banded floor-area range MLS® carries, so they describe the group and not any one home. Not an appraisal or an opinion of value.