Year Built
2010
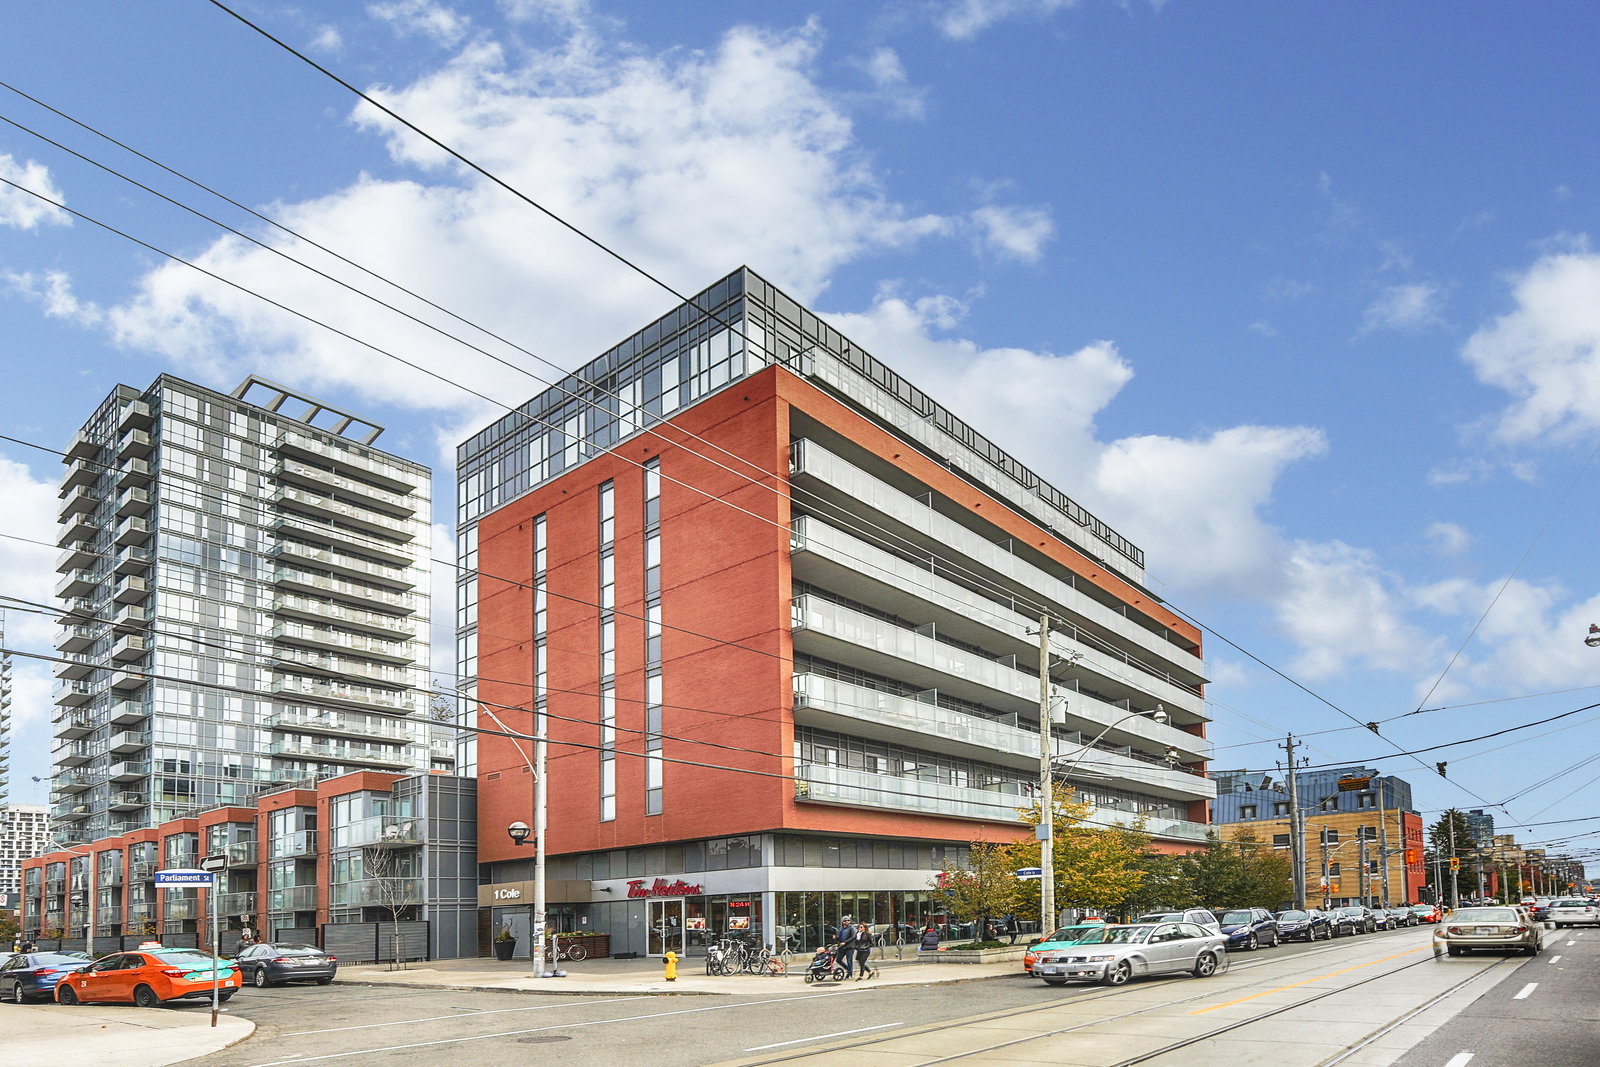
by The Daniels Corporation
1-25 Cole Street, Toronto, ON M5A 4M2
Year Built
2010
Total Units
293
Avg $/sqft
$830
Storeys
19
0
Units for sale
0
Units for rent
Live MLS · Updated daily
With a strong dedication to the neighbourhood and its community, the illustrious Daniels Corporation led a group of high-profile partners, including the Royal Bank of Canada, Sobeys and Tim Hortons, in the revitalization of the Regent Park neighbourhood. This undertaking started with the One Cole Condos, a socially and environmentally conscious, but nonetheless beautiful building.
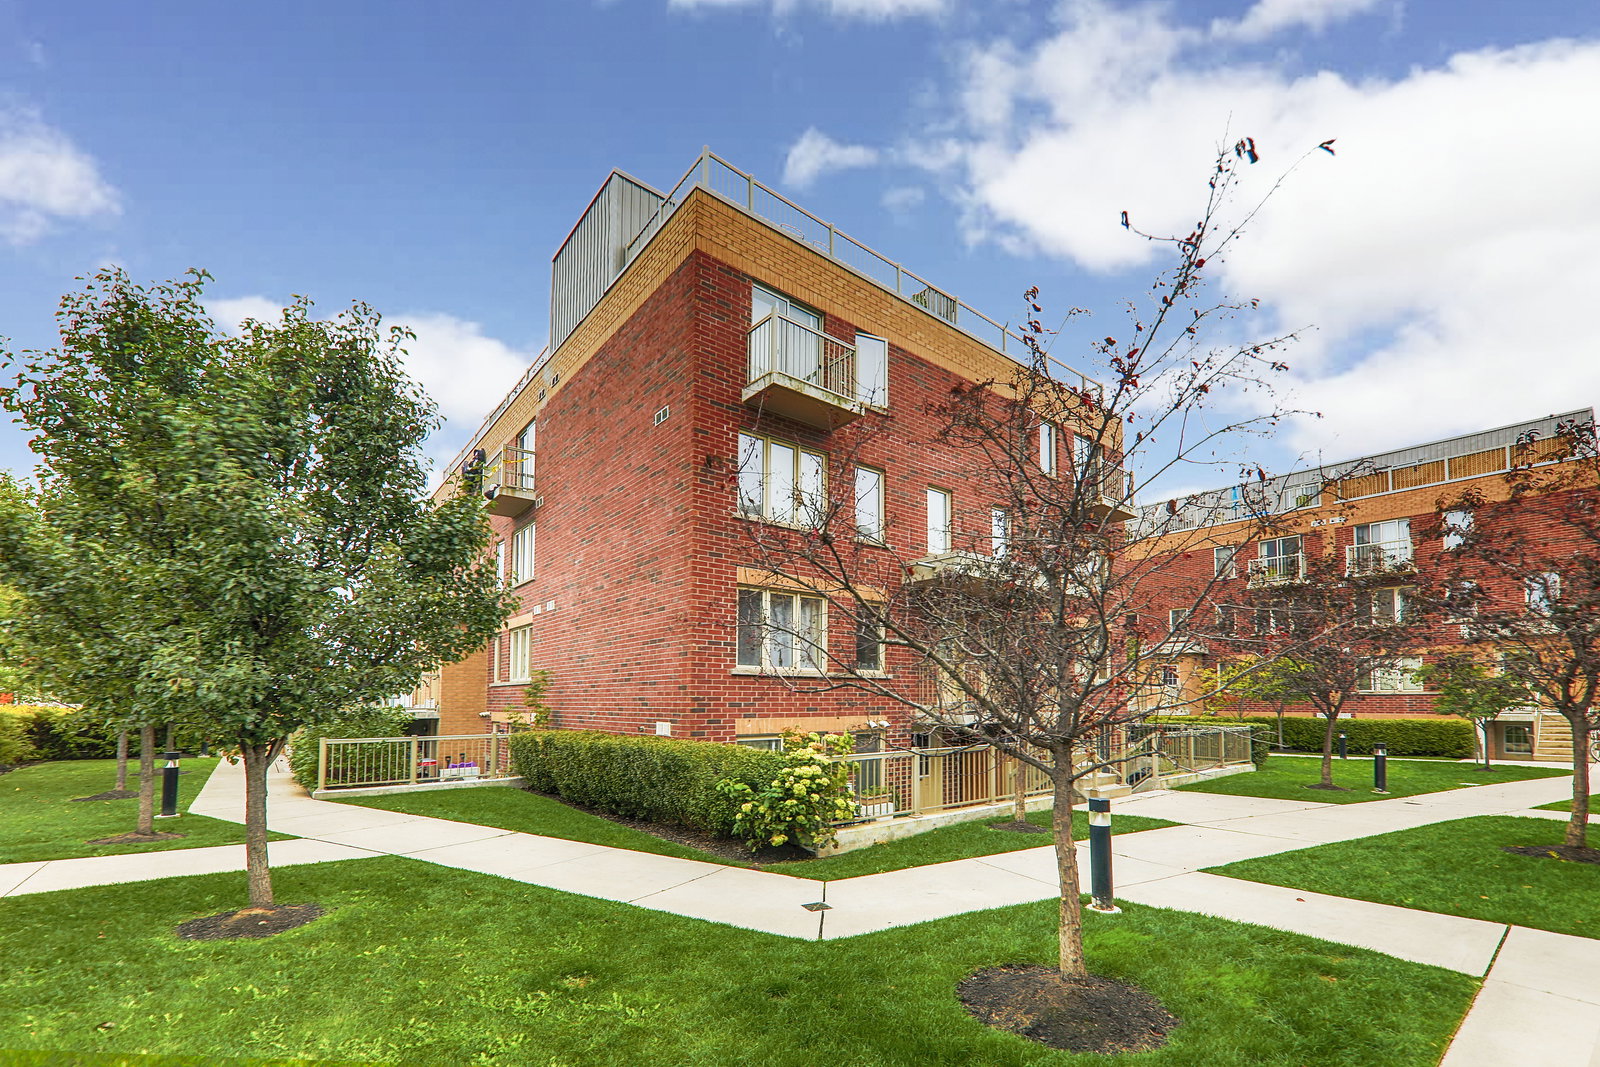
Completed in 2010, this development stretches along 1-25 Cole Street, and features architectural design by Diamond Schmitt Architects. Aiming to establish a vibrant and fresh atmosphere, the designers carefully crafted the brick façade to frame the long, airy balconies of these richly textured, modern glass structures.
Indeed, the structure at 1-25 Cole is resoundingly modern: recognized for its eco-friendly design, it took home the 2010 Green Toronto Award and a LEED Gold Certification. The One Cole Condos features an innovative Living Wall, whose plant life act as a natural air filter for the building — just one of the many green features in the building. There are heat-recovery vents and a spectacular rooftop garden as well — features not found in most Toronto condos for sale.
Lastly, there are many amenities to be found at 1-25 Cole, like a 24-hour concierge service, a massive fitness centre, and an extraordinary party room. The last of these occupies a large 2-storey glass section of the building — a bright space wherein residents are proud to host friends and family.
Developer
The Daniels Corporation
Year Built
2010
Property Type
Mid-Rise Condo
Storeys
19
Total Units
293
Management
Gpm Property Management Inc
Underground Parking
Guest Suites
Fitness Centre
Rooftop Garden
Visitor Parking
Party Room
Bike Storage
24/7 Concierge
$830
Avg $/sqft
-5.6%
YoY change
26
Avg days on market
Walk Score
96/100
Daily errands on foot
Transit Score
100/100
TTC, GO, subway access
Bike Score
75/100
Bike lanes & infrastructure
Neighbourhood in Toronto
Regent Park is a vibrant neighbourhood in Toronto known for its walkability and community spirit. It offers a mix of residential and recreational spaces, making it a great place to live.
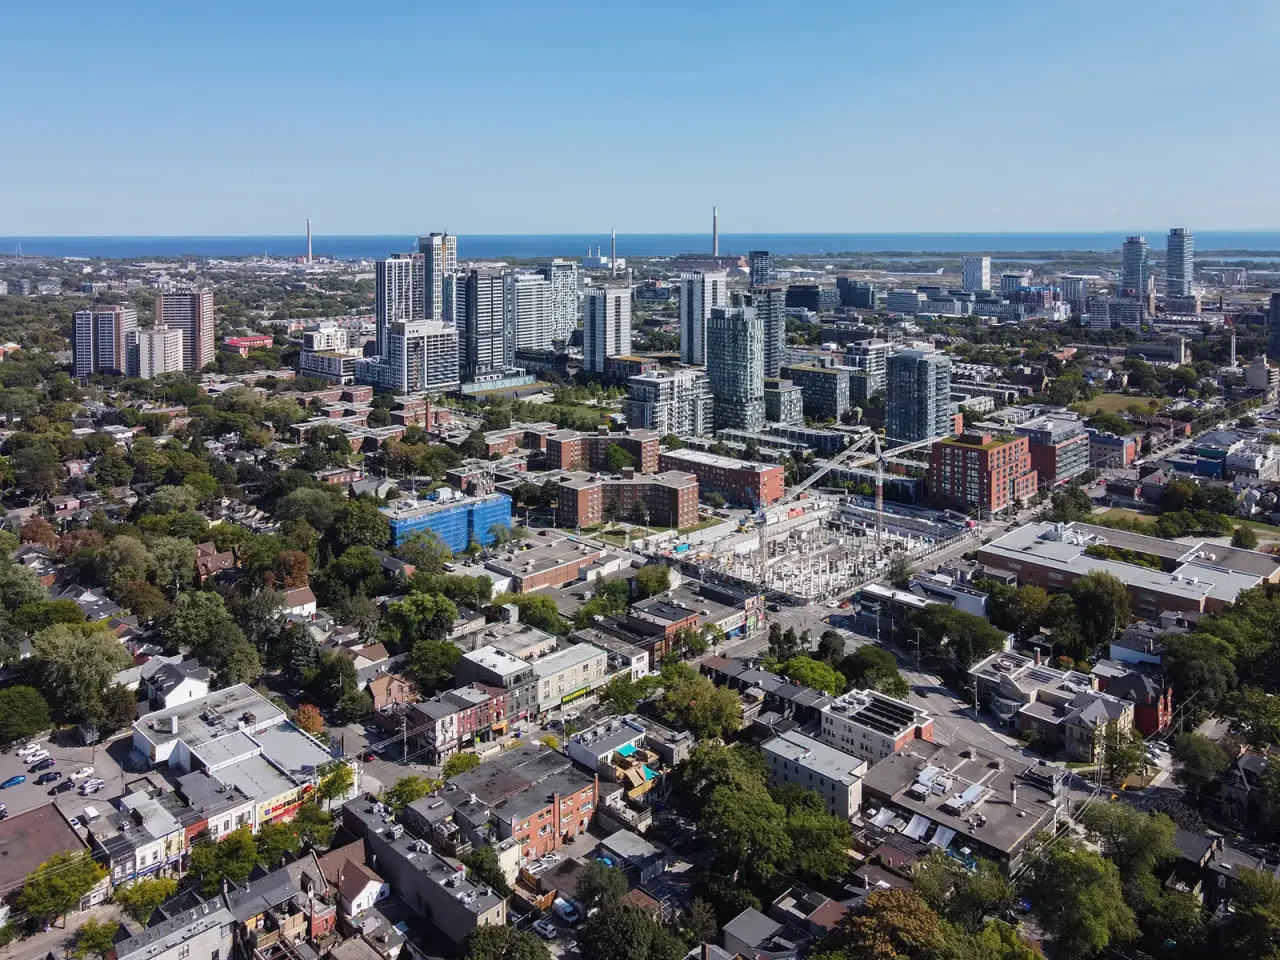
Toronto, Ontario
© Wikimedia Commons contributors (CC BY-SA)
Median asking price
In Ontario
$716,900
Median monthly rent
In Ontario
$2,499
For sale
0
For rent
0
Recently sold
Sign in to see sold data
Recently leased
Sign in to see leased data
Market data as of 2026-08-16. Sold and leased figures are neighbourhood medians over the last 12 months, published only where at least 5 homes closed — never a single sale.
What people love
Keep in mind
Daily life in Regent Park is active and community-oriented, with easy access to local services.
The boundary
0.7 km²
Every count and every census figure on this page was measured inside this line — not within a circle drawn around a centre point.
4
Parks
10
Playgrounds
17
Transit stations
2
Grocery stores
12
Restaurants
7
Cafés
1
Gyms
3
Pharmacies
Counted across all 0.7 km² of Regent Park. From OpenStreetMap, as of 2026-10-12.
3.9/10
Average rating of the 1 rated school in this area
1
Elementary
1
Secondary
Nelson Mandela Park Public School
Public · Grades JK–8 · Toronto DSB
2,601st of 3,045 Ontario elementary schools
385 students · EQAO 2024-2025
June Callwood CentreforWomenandFamilies
Public · Grades 9–12 · Toronto DSB
Not rated
Ontario Ministry of Education school registry; ratings from the Fraser Institute report card. These are the schools that stand inside Regent Park, not a catchment — most Ontario boards do not publish attendance boundaries, and we will not draw a line we cannot source. Confirm enrolment with the school board before you buy.
12,797
Population (2021)
0.6 km²
Area
20,027
People per km²
35.9
Median age
$67,113
Median income
29%
Own their home
2.2
People per household
6,110
Households
Every age
What is built here
Own or rent
29%Owners
71%Renters
Across 6,110 households
When it was built
Mostly 2016–2021
Share of occupied homes, by the era they were built in. Bars are drawn against the busiest era, not against each other, because the eras are not the same length. The eight shares are unlikely to total exactly 100: Statistics Canada rounds each era's count to the nearest 5 before publishing it, so we print what the census reports rather than adjusting a figure to make the column add up.
Statistics Canada, Census of Population 2021. Added up from 13 census areas inside the boundary. Medians and rates are a population-weighted average of dissemination-area figures.
Sources: HOMEH listings, Statistics Canada, Census of Population 2021, OpenStreetMap, HOMEH school registry, Photo: © Wikimedia Commons contributors (CC BY-SA)