Year Built
2008
by E-Park Developments Corporation
1100 Lansdowne Avenue, Toronto, ON M6H4K1
Year Built
2008
Total Units
104
Avg $/sqft
$749
Storeys
3
2
Units for sale
From $525,900
1
Unit for rent
From $5,100/mo
Live MLS · Updated daily
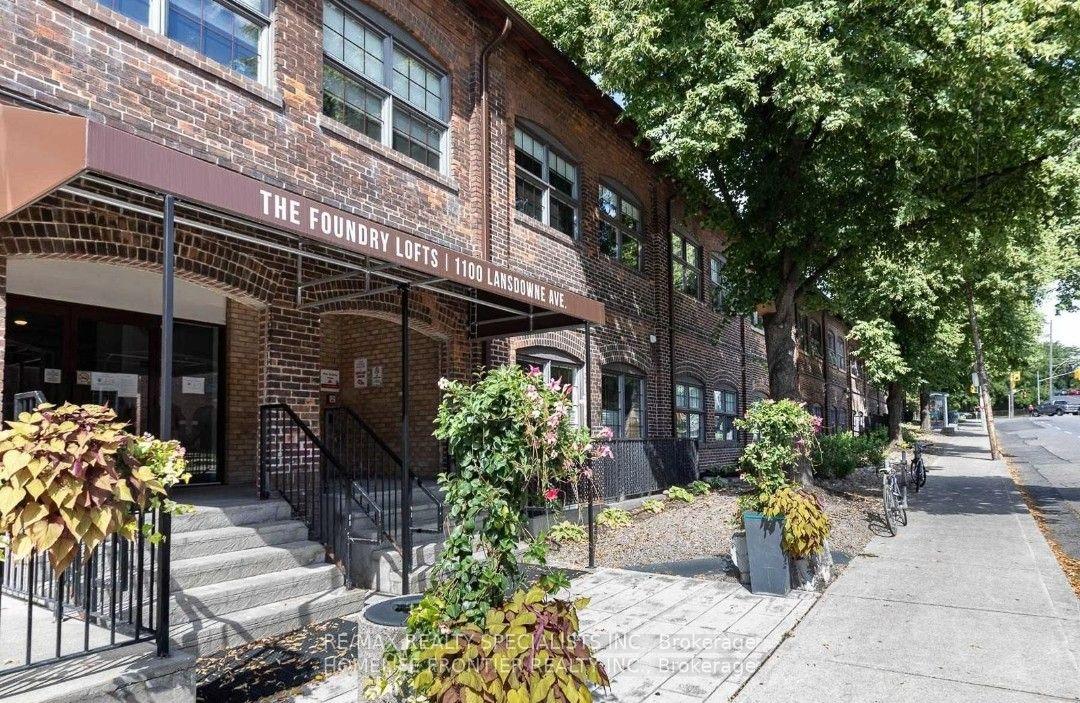
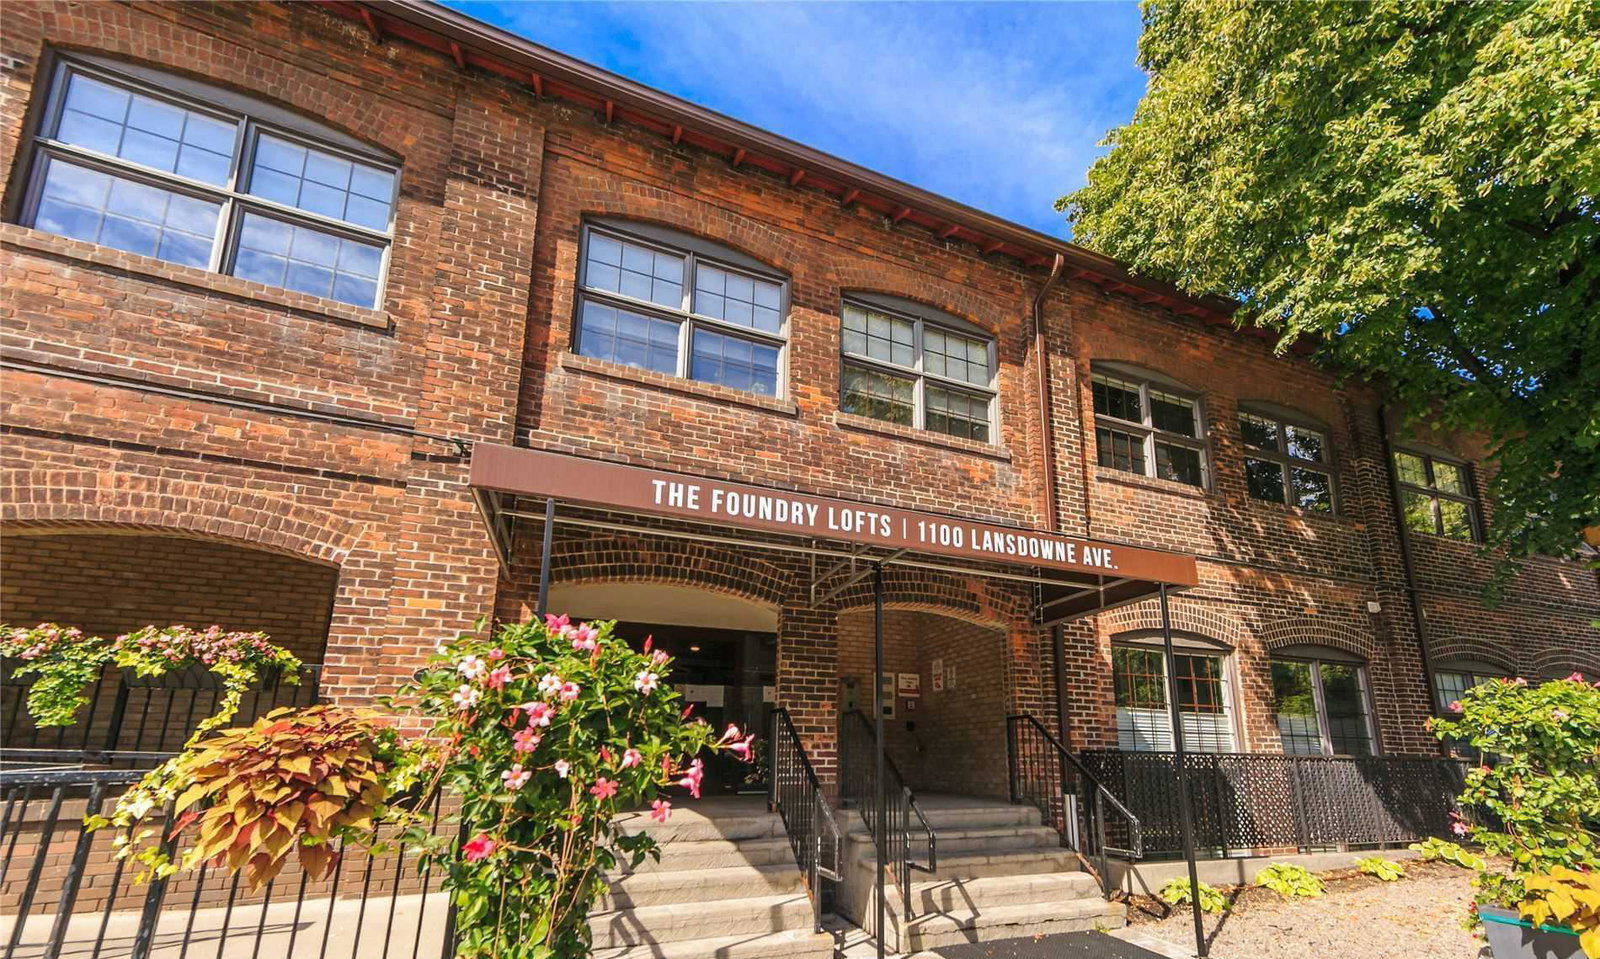
From first glance, it’s quite obvious that the Foundry Lofts are special. Rather than being special in a sparkling glass tower sort of way, the authentic hard loft at 1100 Lansdowne Avenue has the sort of remarkable quality that only 100-year-old buildings have acquired over time. Curious to know more? There’s a heritage plaque out front that explains the Foundry Lofts’ historical significance, and interior walls are even decorated with archival photographs that tell the building’s story.
But rather than making our readers make an extra trip, we’ll explain a little about the history of 1100 Lansdowne here. In the late 1800s, the Canadian Foundry Corporation (CFC) began producing railcars on Front Street in Toronto. After about 30 years, the manufacturing plant moved to this very location on Lansdowne Avenue. Their new factory was so large that the CFC was able to branch out — 1100 Lansdowne quickly became the site where everything from railroad tracks to fire hydrants were created.
As of the late 20th century, the factory ceased production, as did many industrial spaces in Toronto’s downtown core. While it took about 25 years to decide what to do with the structure, thankfully in 2004 it was granted heritage status. E-Park Developments stepped into the picture a few years later, carefully converting the former factory into just over 100 Toronto lofts ready to be inhabited in 2008.
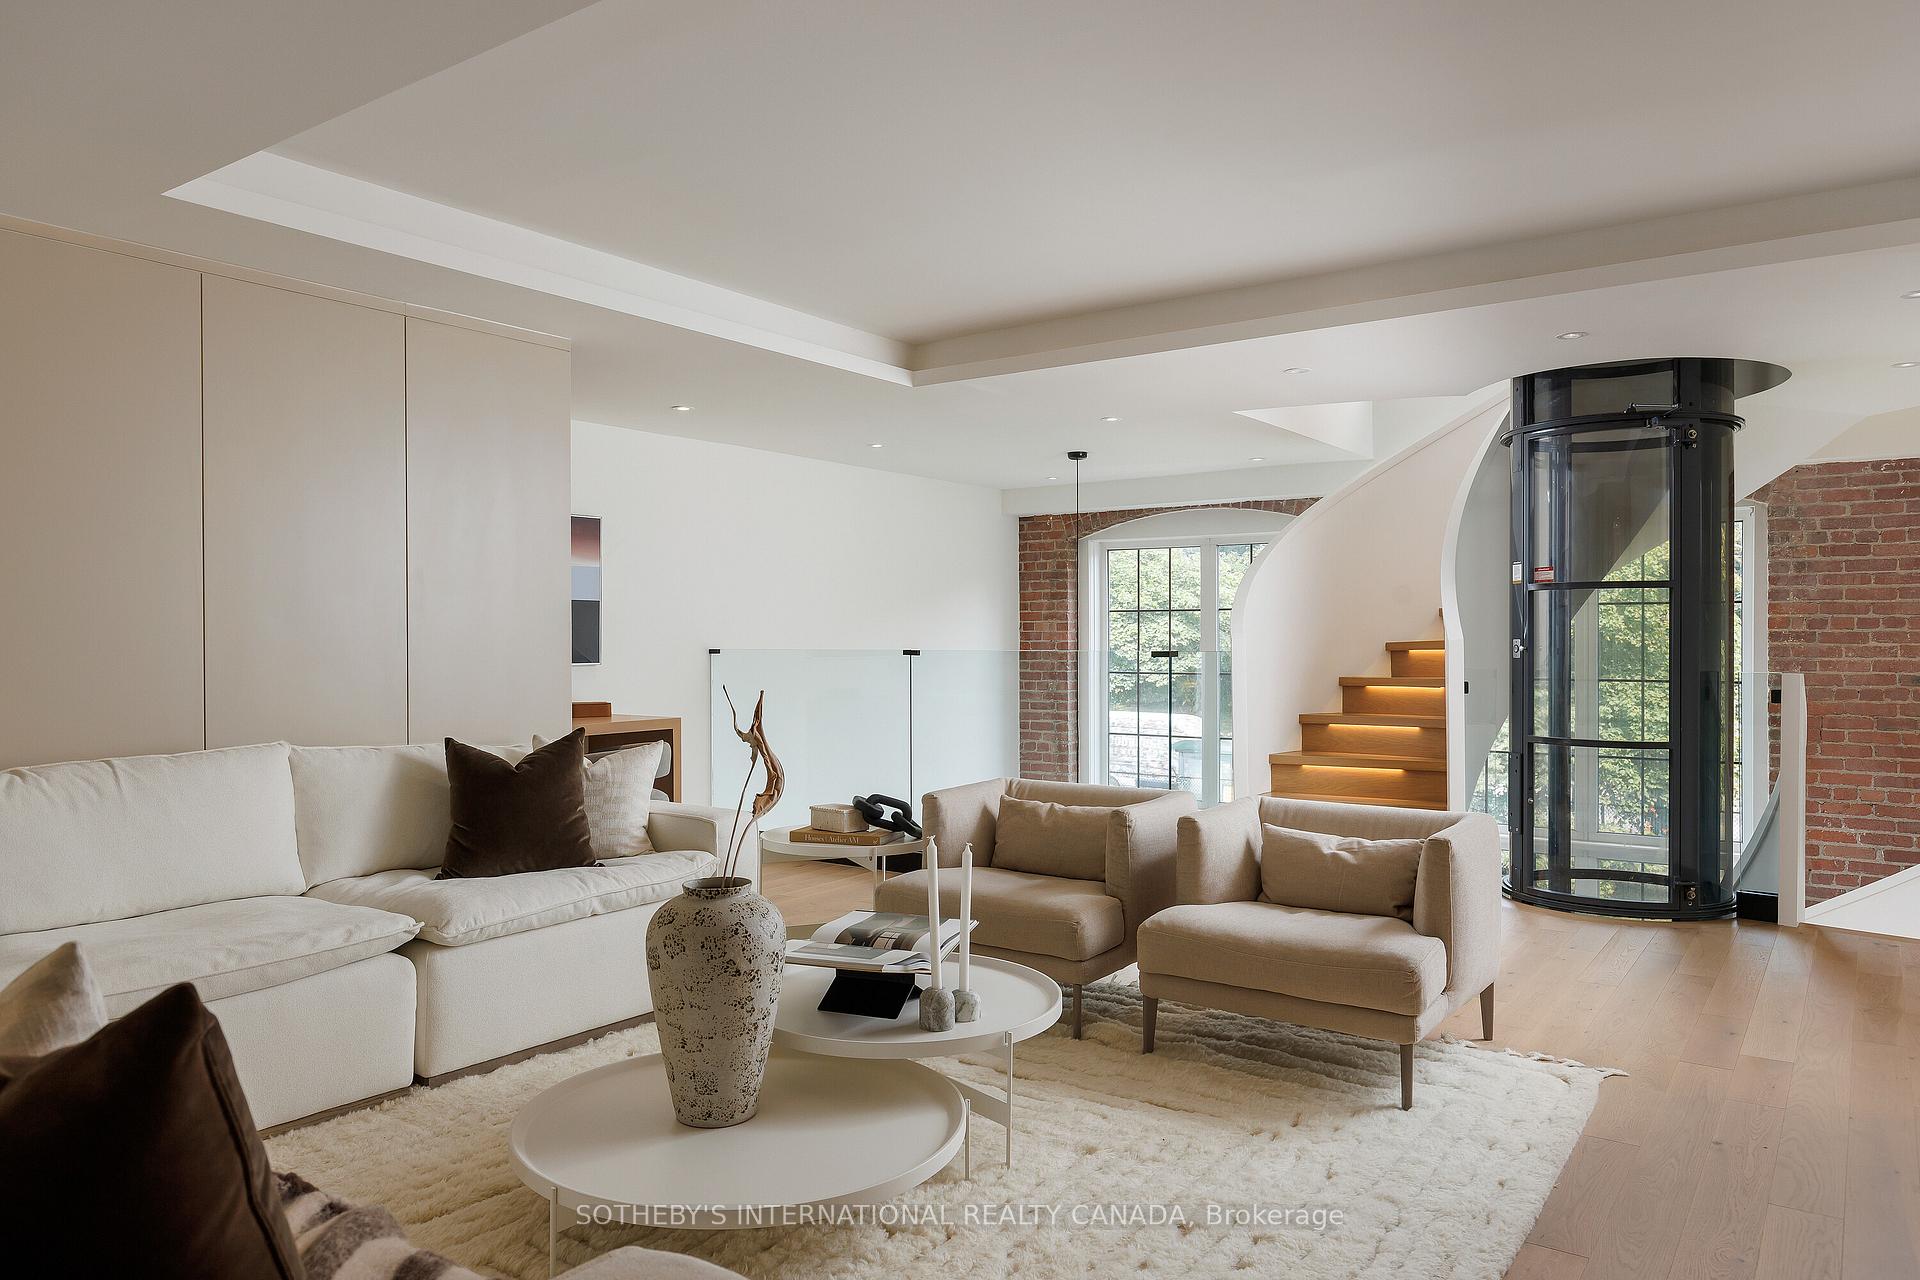
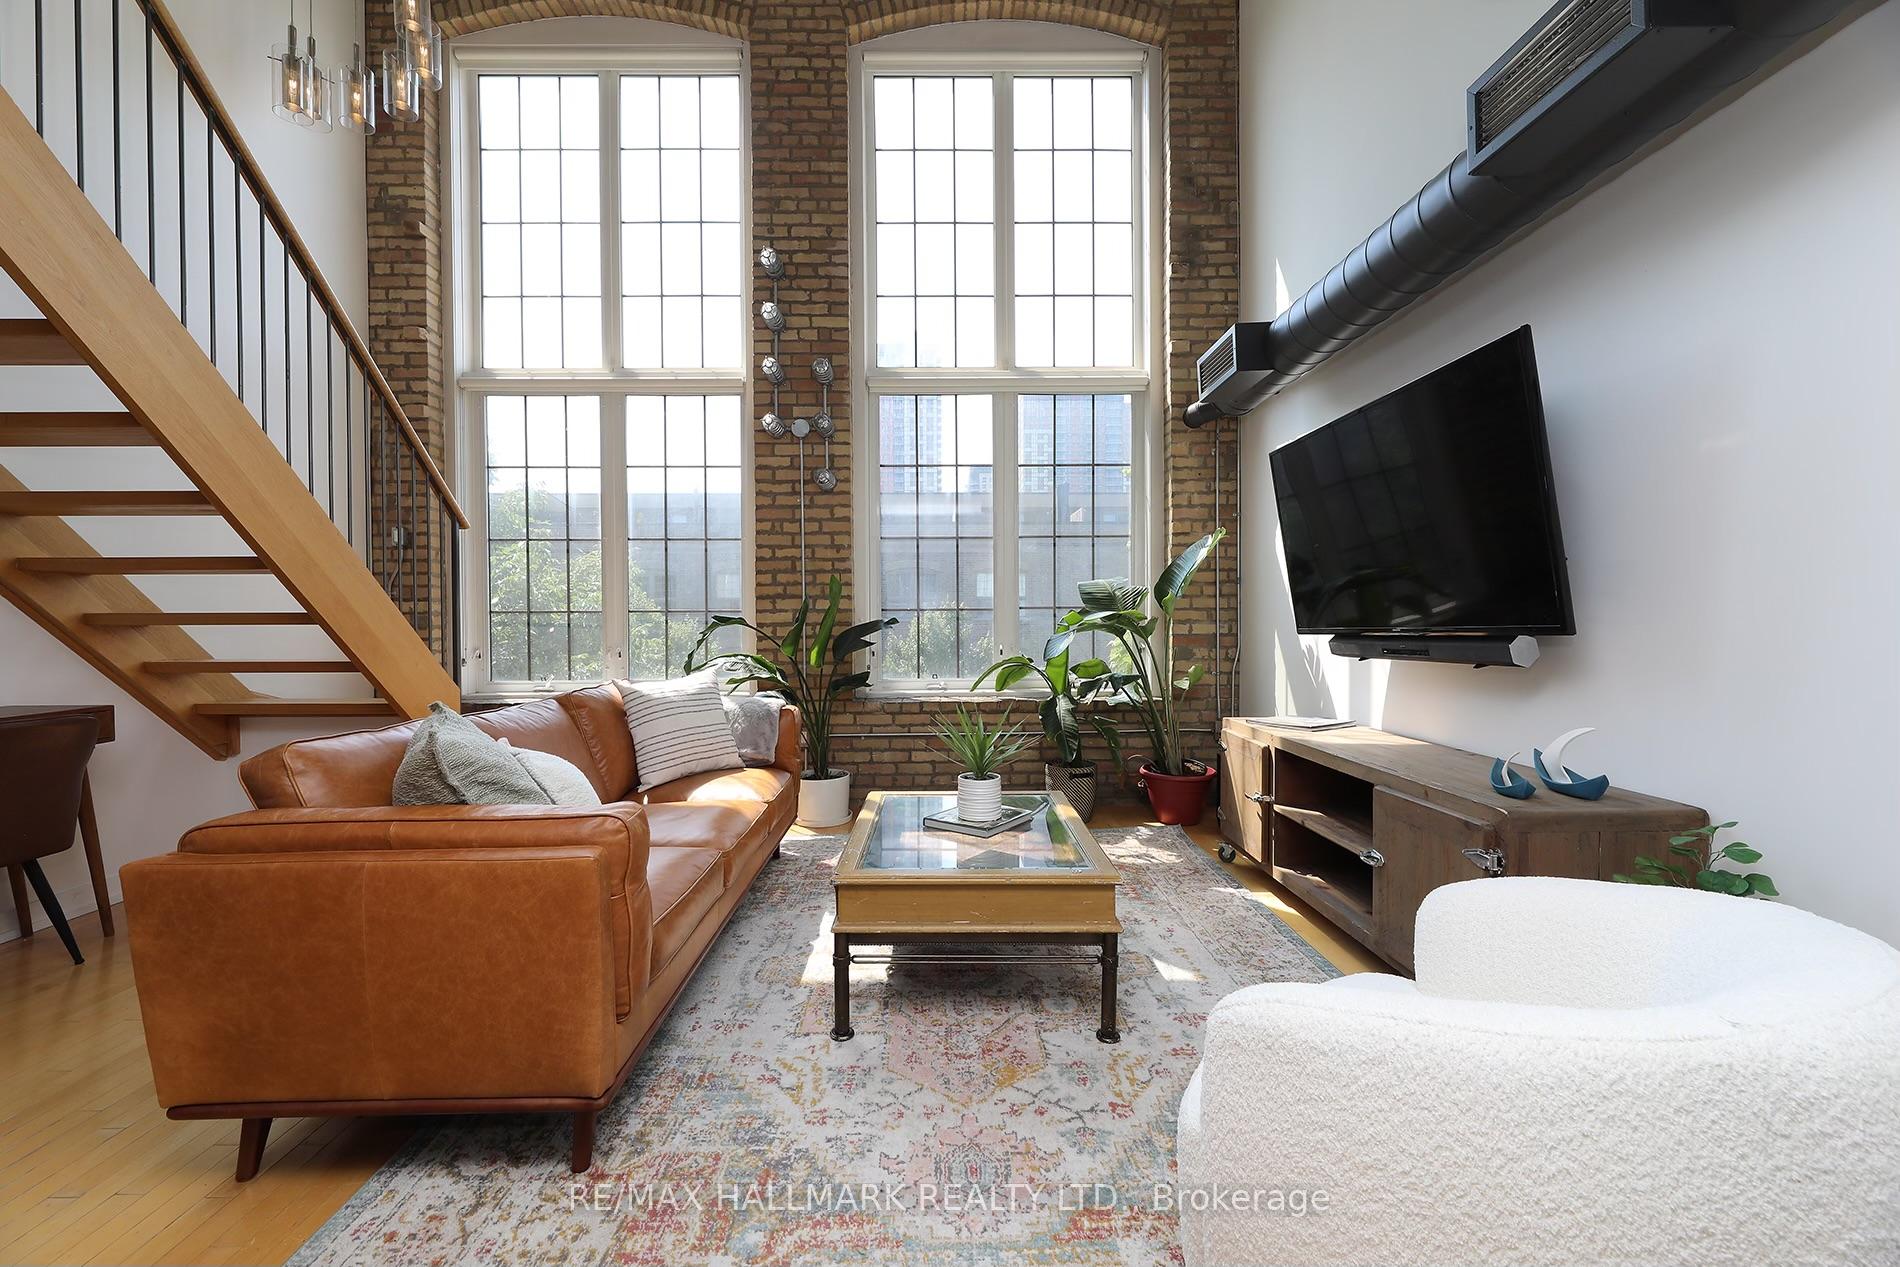
Burka Architects did the design work, and managed to carve liveable hard lofts out of the building’s skeletal structure, while maintaining the integrity of the building at the same time. The deep red brick looks perfectly worn from the outside, and can again be appreciated from the 16,000 square foot atrium once inside. Since creative repurposing is what a good hard loft conversion is all about, it only makes sense that developers would place a parking garage where trains were once stored.
Residents are proud of their building’s heritage: a beautification project is headed up by volunteer residents, who are responsible for the photographs on the walls as well as other art found throughout the building.
Besides this project, the building has a general sense of community unmatched by many other condos in the city: loft socials are held in the atrium on major holidays. For those in need of some more privacy, however, there’s always a smaller party room available. The building also boasts a meeting room, a theatre, and exercise facilities.
Developer
E-Park Developments Corporation
Year Built
2008
Property Type
Low-Rise Condo
Storeys
3
Total Units
104
Management
Maple Ridge Community Management
Rec Room
Security System
Fitness Centre
Visitor Parking
Theatre Room
Party Room
Bike Storage
$749
Avg $/sqft
-8.7%
YoY change
43
Avg days on market
Walk Score
75/100
Daily errands on foot
Transit Score
81/100
TTC, GO, subway access
Bike Score
61/100
Bike lanes & infrastructure
Neighbourhood in Toronto
Dovercourt-Wallace Emerson-Junction is a vibrant neighbourhood in Toronto. It offers a mix of amenities, parks, and schools, making it a great place to live.
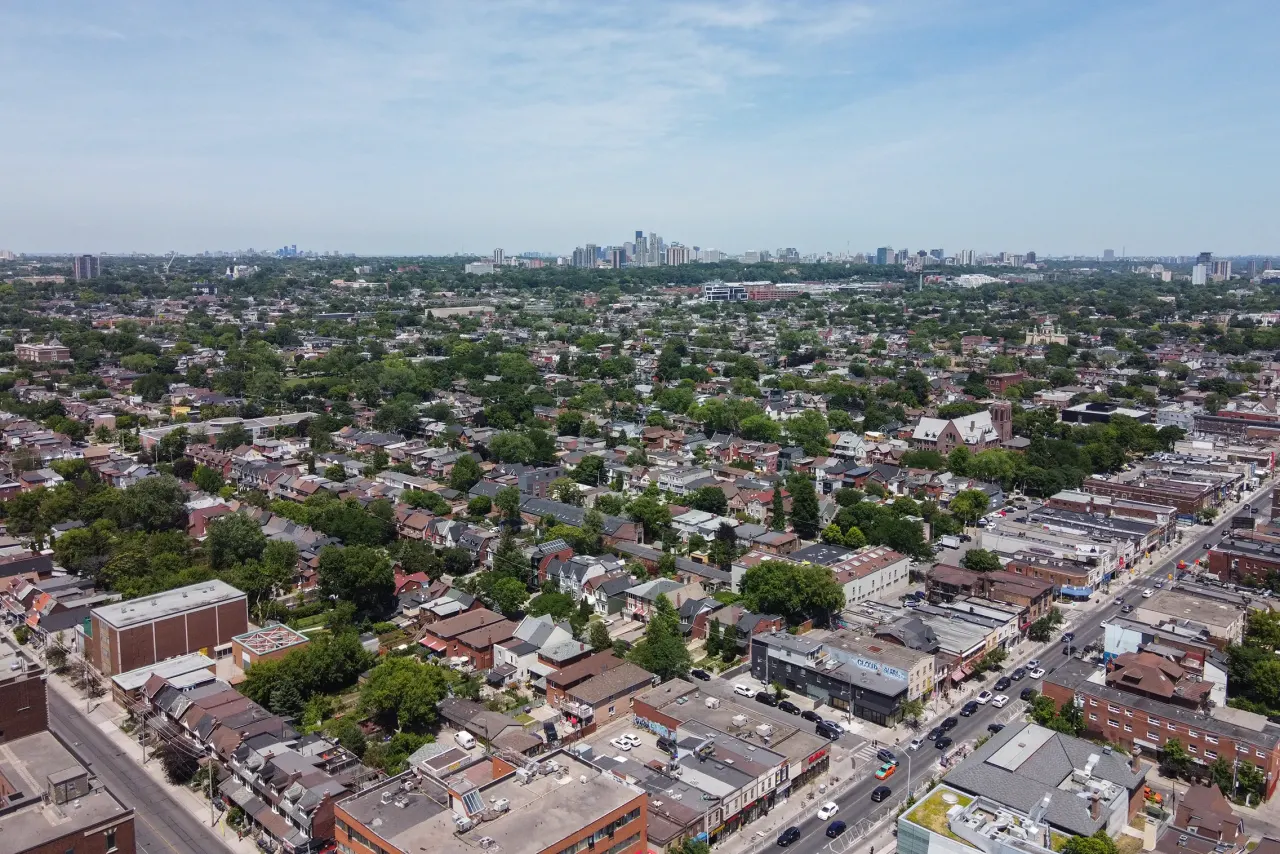
Toronto, Ontario
© Wikimedia Commons contributors (CC BY-SA)
Median asking price
In Ontario
$716,900
Median monthly rent
In Ontario
$2,499
For sale
0
For rent
0
Recently sold
Sign in to see sold data
Recently leased
Sign in to see leased data
Market data as of 2026-08-16. Sold and leased figures are neighbourhood medians over the last 12 months, published only where at least 5 homes closed — never a single sale.
What people love
Keep in mind
Daily life here is active and community-oriented, with many local amenities. Residents enjoy easy access to parks and transit.
The boundary
3.7 km²
Every count and every census figure on this page was measured inside this line — not within a circle drawn around a centre point.
25
Parks
30
Playgrounds
15
Transit stations
10
Grocery stores
54
Restaurants
28
Cafés
12
Gyms
1
Libraries
10
Pharmacies
Counted across all 3.7 km² of Dovercourt-Wallace Emerson-Junction. From OpenStreetMap, as of 2026-10-12.
6.9/10
Average rating of the 9 rated schools in this area
12
Elementary
3
Secondary
St Sebastian Catholic School
Catholic · Grades JK–8 · Toronto CDSB
1st of 3,045 Ontario elementary schools
250 students · EQAO 2024-2025
St Mary of the Angels Catholic School
Catholic · Grades JK–8 · Toronto CDSB
476th of 3,045 Ontario elementary schools
230 students · EQAO 2024-2025
St Anthony Catholic School
Catholic · Grades JK–8 · Toronto CDSB
626th of 3,045 Ontario elementary schools
205 students · EQAO 2024-2025
Pauline Junior Public School
Public · Grades JK–6 · Toronto DSB
888th of 3,045 Ontario elementary schools
210 students · EQAO 2024-2025
Hawthorne II Bilingual Alternative Junior School
Public · Grades JK–6 · Toronto DSB
1,026th of 3,045 Ontario elementary schools
155 students · EQAO 2024-2025
Dovercourt Public School
Public · Grades JK–8 · Toronto DSB
1,525th of 3,045 Ontario elementary schools
365 students · EQAO 2024-2025
Ontario Ministry of Education school registry; ratings from the Fraser Institute report card. These are the schools that stand inside Dovercourt-Wallace Emerson-Junction, not a catchment — most Ontario boards do not publish attendance boundaries, and we will not draw a line we cannot source. Confirm enrolment with the school board before you buy.
35,862
Population (2021)
3.7 km²
Area
9,646
People per km²
38.6
Median age
$87,925
Median income
52%
Own their home
2.3
People per household
15,505
Households
Every age
What is built here
Own or rent
52%Owners
48%Renters
Across 15,505 households
When it was built
Mostly 1960 or earlier
Share of occupied homes, by the era they were built in. Bars are drawn against the busiest era, not against each other, because the eras are not the same length. The eight shares are unlikely to total exactly 100: Statistics Canada rounds each era's count to the nearest 5 before publishing it, so we print what the census reports rather than adjusting a figure to make the column add up.
Statistics Canada, Census of Population 2021. Added up from 66 census areas inside the boundary. Medians and rates are a population-weighted average of dissemination-area figures.
Sources: HOMEH listings, Statistics Canada, Census of Population 2021, OpenStreetMap, HOMEH school registry, Photo: © Wikimedia Commons contributors (CC BY-SA)