Year Built
2003
by Paul De Haas
189 Queen Street E, Toronto, ON M5A1S2
Year Built
2003
Total Units
11
Storeys
3
0
Units for sale
0
Units for rent
Live MLS · Updated daily
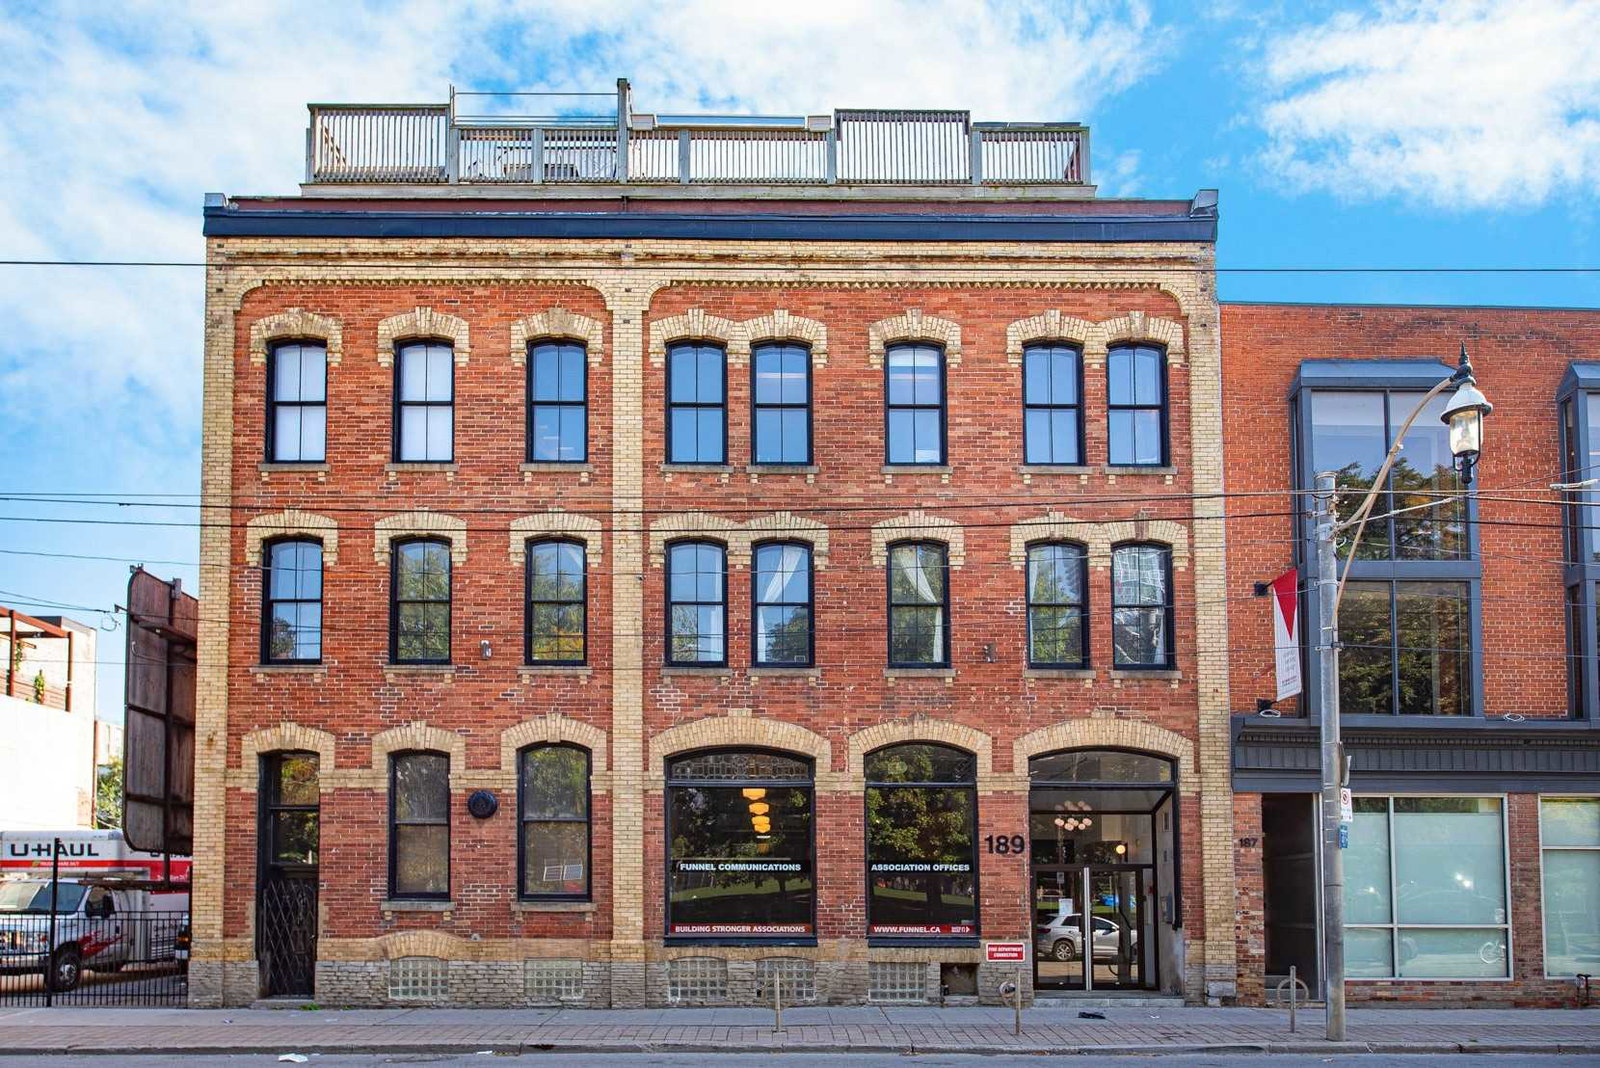
As the name so plainly suggests, the Boiler Factory Lofts inhabit a converted boiler factory in the Moss Park neighbourhood. However, the building itself and the Toronto lofts within are anything but ordinary.
First of all, the Boiler Factory stands out for their age: constructed in the 1880’s, this positions the building amongst some of the oldest conversions in the city. Then there’s the aesthetic factor. Even just the view from the street showcases the superior composition of the structure at 189 Queen Street East. Red brick is highlighted by yellow brick accents atop the plentiful, gently arched windows.
Converted in 2003, the former factory was given a new life with a residential purpose. The three-storey building now houses 11 hard lofts in a vibrant corner of downtown Toronto, along with amenities such as a swimming pool, exercise facilities, and a shared rooftop terrace.
Developer
Paul De Haas
Year Built
2003
Property Type
Low-Rise Condo
Storeys
3
Total Units
11
Management
Goldview Property Management Ltd
Security System
BBQ Area
—
Avg $/sqft
-0.0%
YoY change
41
Avg days on market
Walk Score
98/100
Daily errands on foot
Transit Score
100/100
TTC, GO, subway access
Bike Score
75/100
Bike lanes & infrastructure
Neighbourhood in Toronto
Moss Park is a vibrant neighborhood in Toronto. It offers a mix of amenities and a strong community feel.
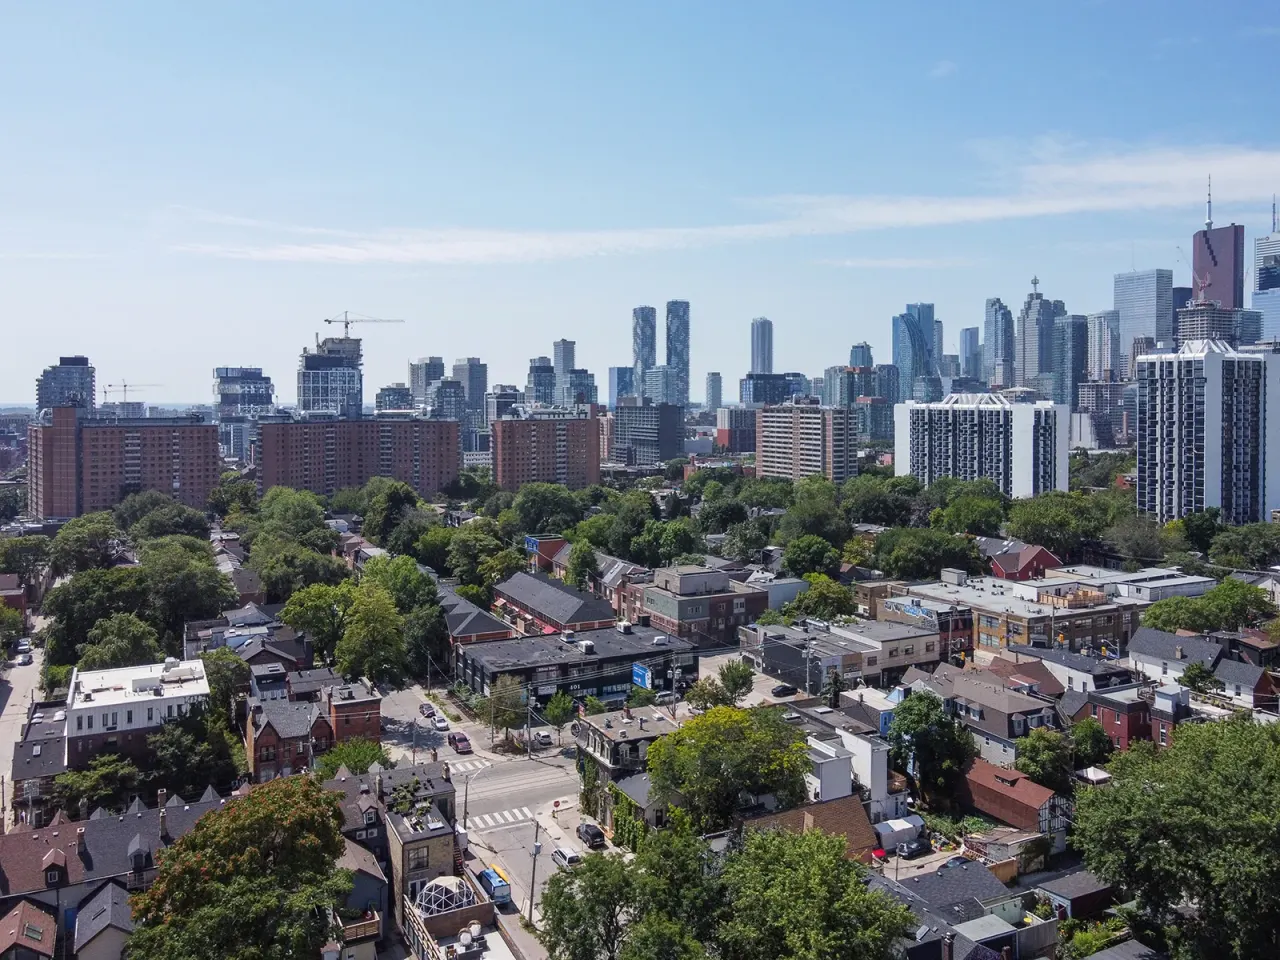
Toronto, Ontario
© Wikimedia Commons contributors (CC BY-SA)
Median asking price
In Ontario
$716,900
Median monthly rent
In Ontario
$2,499
For sale
0
For rent
0
Recently sold
Sign in to see sold data
Recently leased
Sign in to see leased data
Market data as of 2026-08-16. Sold and leased figures are neighbourhood medians over the last 12 months, published only where at least 5 homes closed — never a single sale.
What people love
Keep in mind
Daily life in Moss Park is active and community-oriented, with easy access to shops and parks. Residents enjoy a lively atmosphere.
The boundary
1.4 km²
Every count and every census figure on this page was measured inside this line — not within a circle drawn around a centre point.
13
Parks
15
Playgrounds
32
Transit stations
3
Grocery stores
40
Restaurants
19
Cafés
4
Gyms
1
Libraries
9
Pharmacies
Counted across all 1.4 km² of Moss Park. From OpenStreetMap, as of 2026-10-19.
6.5/10
Average rating of the 3 rated schools in this area
4
Elementary
2
Secondary
St Paul Catholic School
Catholic · Grades JK–8 · Toronto CDSB
130th of 3,045 Ontario elementary schools
250 students · EQAO 2024-2025
École élémentaire Gabrielle-Roy
Public · French · Grades JK–6 · Conseil scolaire Viamonde
299th of 3,045 Ontario elementary schools
270 students · EQAO 2024-2025
Lord Dufferin Junior and Senior Public School
Public · Grades JK–8 · Toronto DSB
2,853rd of 3,045 Ontario elementary schools
420 students · EQAO 2024-2025
Dixon Hall
Public · Grades 9–12 · Toronto DSB
Not rated
Inglenook Community School
Public · Grades 9–12 · Toronto DSB
Not rated
60 students · EQAO 2024-2025
Liberty Prep School
Independent
Not rated
Ontario Ministry of Education school registry; ratings from the Fraser Institute report card. These are the schools that stand inside Moss Park, not a catchment — most Ontario boards do not publish attendance boundaries, and we will not draw a line we cannot source. Confirm enrolment with the school board before you buy.
22,701
Population (2021)
1.4 km²
Area
16,565
People per km²
37.9
Median age
$72,217
Median income
35%
Own their home
1.6
People per household
13,290
Households
Every age
What is built here
Own or rent
35%Owners
65%Renters
Across 13,290 households
When it was built
Mostly 2016–2021
Share of occupied homes, by the era they were built in. Bars are drawn against the busiest era, not against each other, because the eras are not the same length. The eight shares are unlikely to total exactly 100: Statistics Canada rounds each era's count to the nearest 5 before publishing it, so we print what the census reports rather than adjusting a figure to make the column add up.
Statistics Canada, Census of Population 2021. Added up from 19 census areas inside the boundary. Medians and rates are a population-weighted average of dissemination-area figures.
Sources: HOMEH listings, Statistics Canada, Census of Population 2021, OpenStreetMap, HOMEH school registry, Photo: © Wikimedia Commons contributors (CC BY-SA)