Year Built
2002
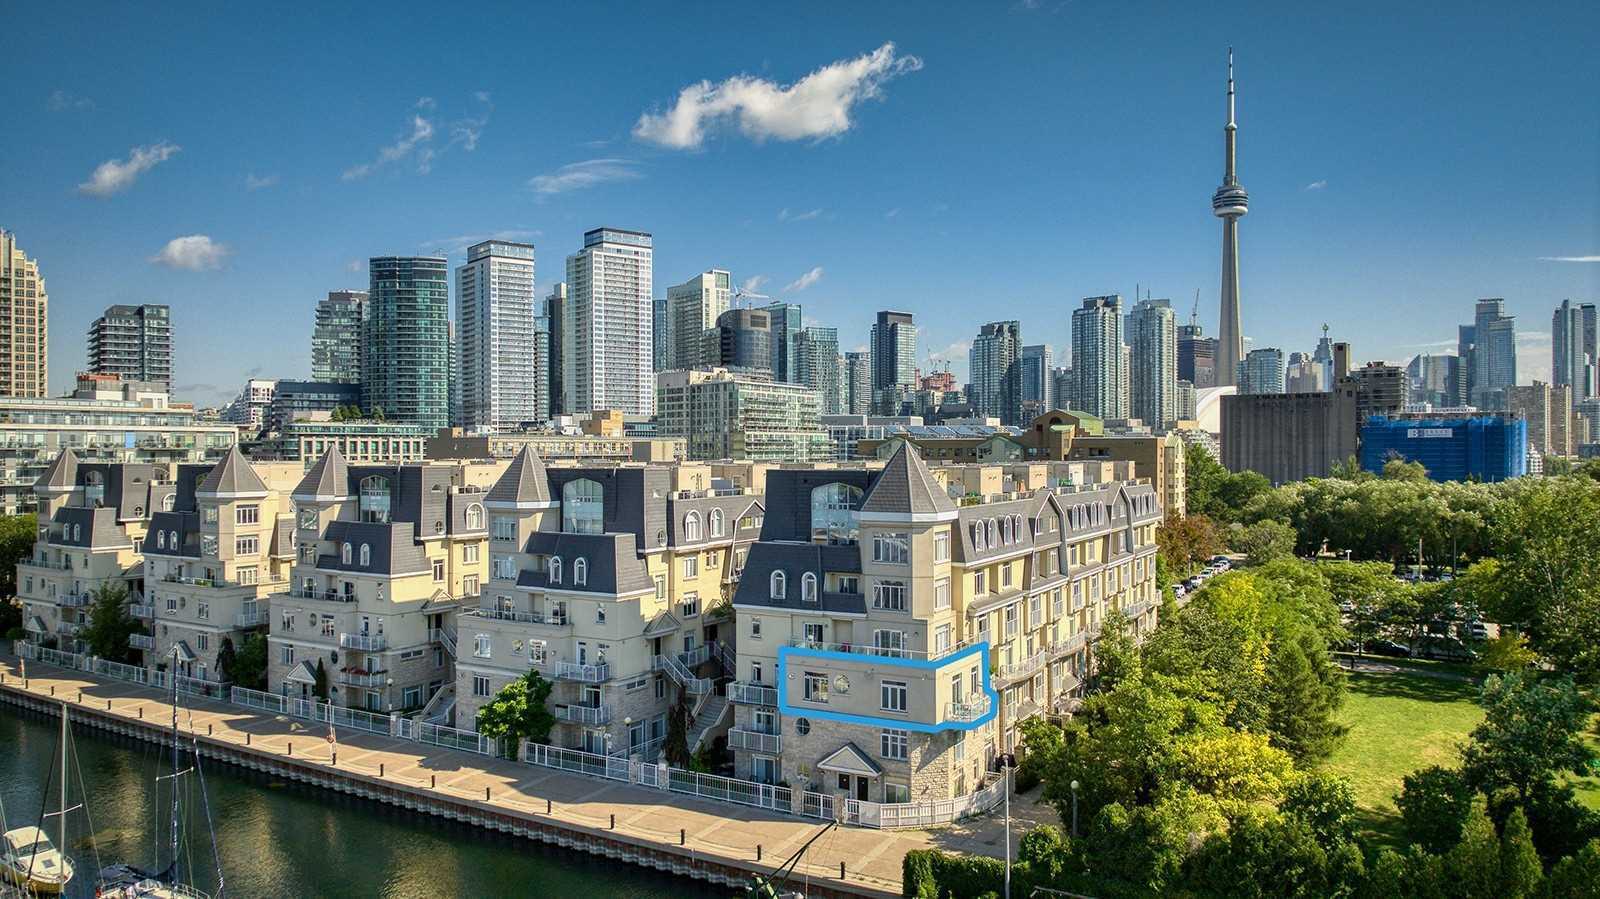
by Urbancorp Development
28-38 Stadium Road, Toronto, ON M5V 3P4
Year Built
2002
Total Units
221
Avg $/sqft
$948
Storeys
3
0
Units for sale
0
Units for rent
Live MLS · Updated daily
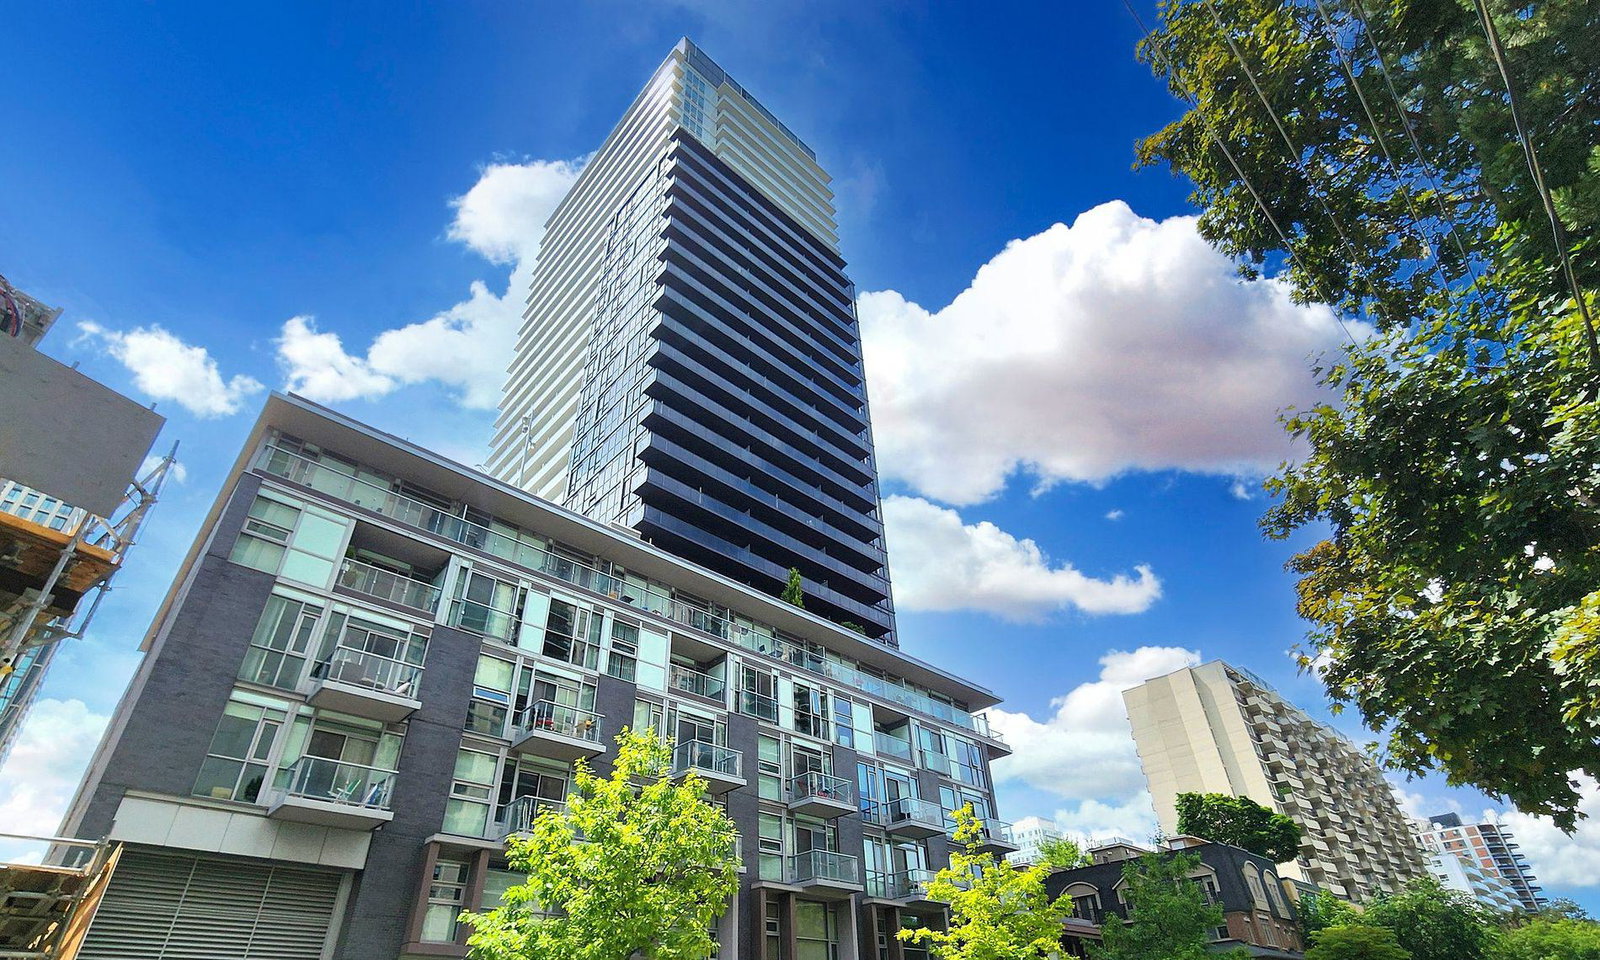
Nestled in the Fort York neighbourhood, Marina Townhomes of South Beach offers a peaceful retreat just steps from the shores from Lake Ontario. At 3-storeys and with 221 units, surrounded by green spaces, this complex feels like a private community; having 2 yacht clubs next door only adds to the sense of exclusivity.
Marina Townhomes of South Beach is located at 28-38 Stadium Road, and while this complex does not boast a list of amenities so long that you’ll lose your breath — as some buildings do — there are a few nice extras here; shared rooftop deck with BBQ space, parking garage, and visitor parking.
These Toronto townhouses have a lot of appeal for small families and empty-nesters; there are units in this complex which have the square footage of a detached home, but without the hassle of lawn maintenance or snow removal. This complex is pet-friendly, so residents can take advantage of the off-leash dog park at Coronation Park.
Developer
Urbancorp Development
Year Built
2002
Property Type
Low-Rise Condo
Storeys
3
Total Units
221
Management
Icon Property Management
Underground Parking
Security System
Rooftop Garden
Visitor Parking
BBQ Area
Bike Storage
$948
Avg $/sqft
+6.9%
YoY change
31
Avg days on market
Walk Score
67/100
Daily errands on foot
Transit Score
87/100
TTC, GO, subway access
Bike Score
74/100
Bike lanes & infrastructure
Neighbourhood in Toronto
Fort York is a vibrant neighbourhood in Toronto. It offers a mix of parks, schools, and plenty of dining options.
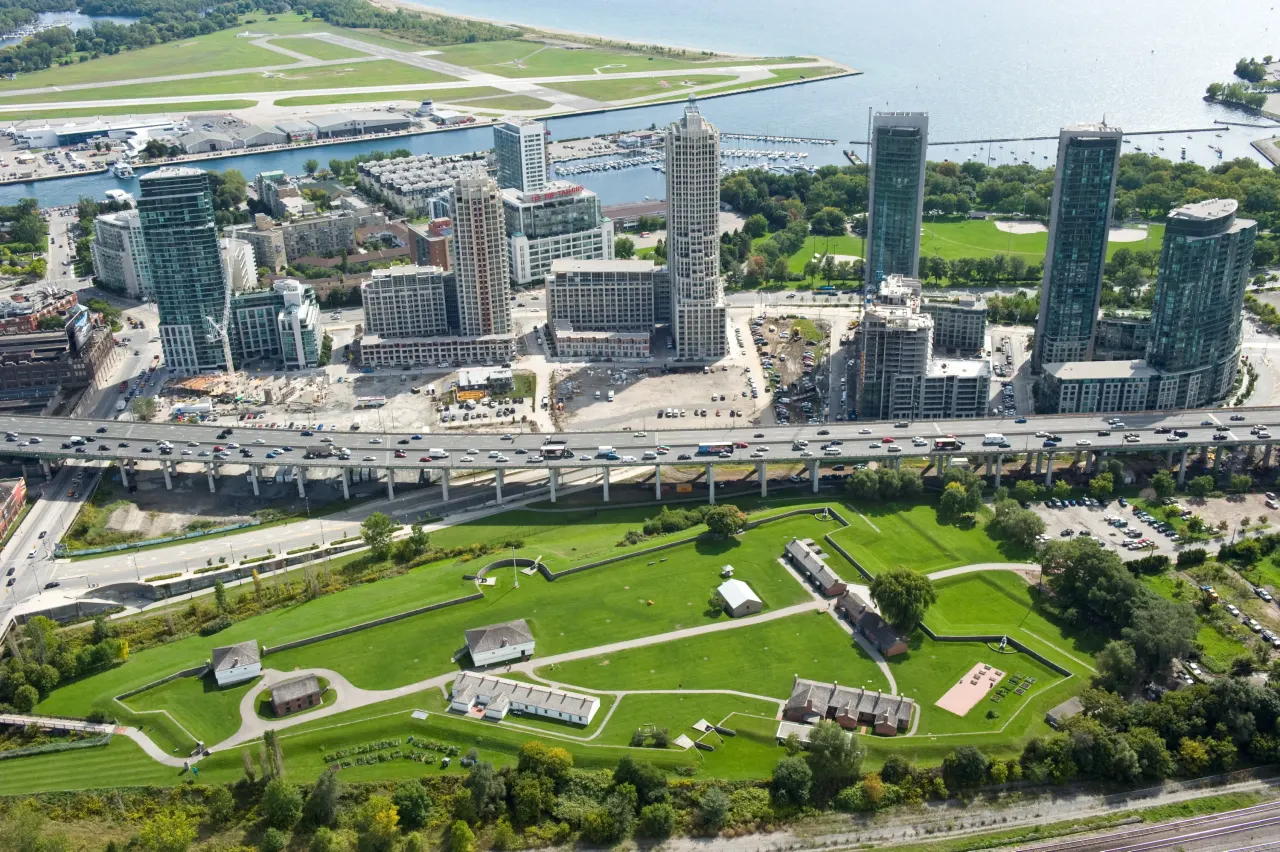
Toronto, Ontario
© Wikimedia Commons contributors (CC BY-SA)
Median asking price
In Ontario
$716,900
Median monthly rent
In Ontario
$2,499
For sale
0
For rent
0
Recently sold
Sign in to see sold data
Recently leased
Sign in to see leased data
Market data as of 2026-08-16. Sold and leased figures are neighbourhood medians over the last 12 months, published only where at least 5 homes closed — never a single sale.
What people love
Keep in mind
Daily life in Fort York is active and community-focused, with many amenities within reach. Residents enjoy a blend of urban living and green spaces.
The boundary
2.3 km²
Every count and every census figure on this page was measured inside this line — not within a circle drawn around a centre point.
19
Parks
8
Playgrounds
13
Transit stations
5
Grocery stores
15
Restaurants
15
Cafés
11
Gyms
3
Pharmacies
Counted across all 2.3 km² of Fort York. From OpenStreetMap, as of 2026-10-26.
20,071
Population (2021)
2.2 km²
Area
9,024
People per km²
32.9
Median age
$93,869
Median income
47%
Own their home
1.6
People per household
12,405
Households
Every age
What is built here
Own or rent
47%Owners
53%Renters
Across 12,405 households
When it was built
Mostly 2011–2015
Share of occupied homes, by the era they were built in. Bars are drawn against the busiest era, not against each other, because the eras are not the same length. The eight shares are unlikely to total exactly 100: Statistics Canada rounds each era's count to the nearest 5 before publishing it, so we print what the census reports rather than adjusting a figure to make the column add up.
Statistics Canada, Census of Population 2021. Added up from 6 census areas inside the boundary. Medians and rates are a population-weighted average of dissemination-area figures.
Sources: HOMEH listings, Statistics Canada, Census of Population 2021, OpenStreetMap, HOMEH school registry, Photo: © Wikimedia Commons contributors (CC BY-SA)