Year Built
1997
by Mel Brown
347 Sorauren Avenue, Toronto, ON M6R2G5
Year Built
1997
Total Units
48
Storeys
2
0
Units for sale
0
Units for rent
Live MLS · Updated daily
Sitting pretty in west end Toronto, Sorauren Street has just lately begun to receive the attention it truly deserves. While trendsetters in this city have been well aware of the residential potential of industrial buildings since the 1990s, this Roncesvalles area street is finally experiencing its heyday.
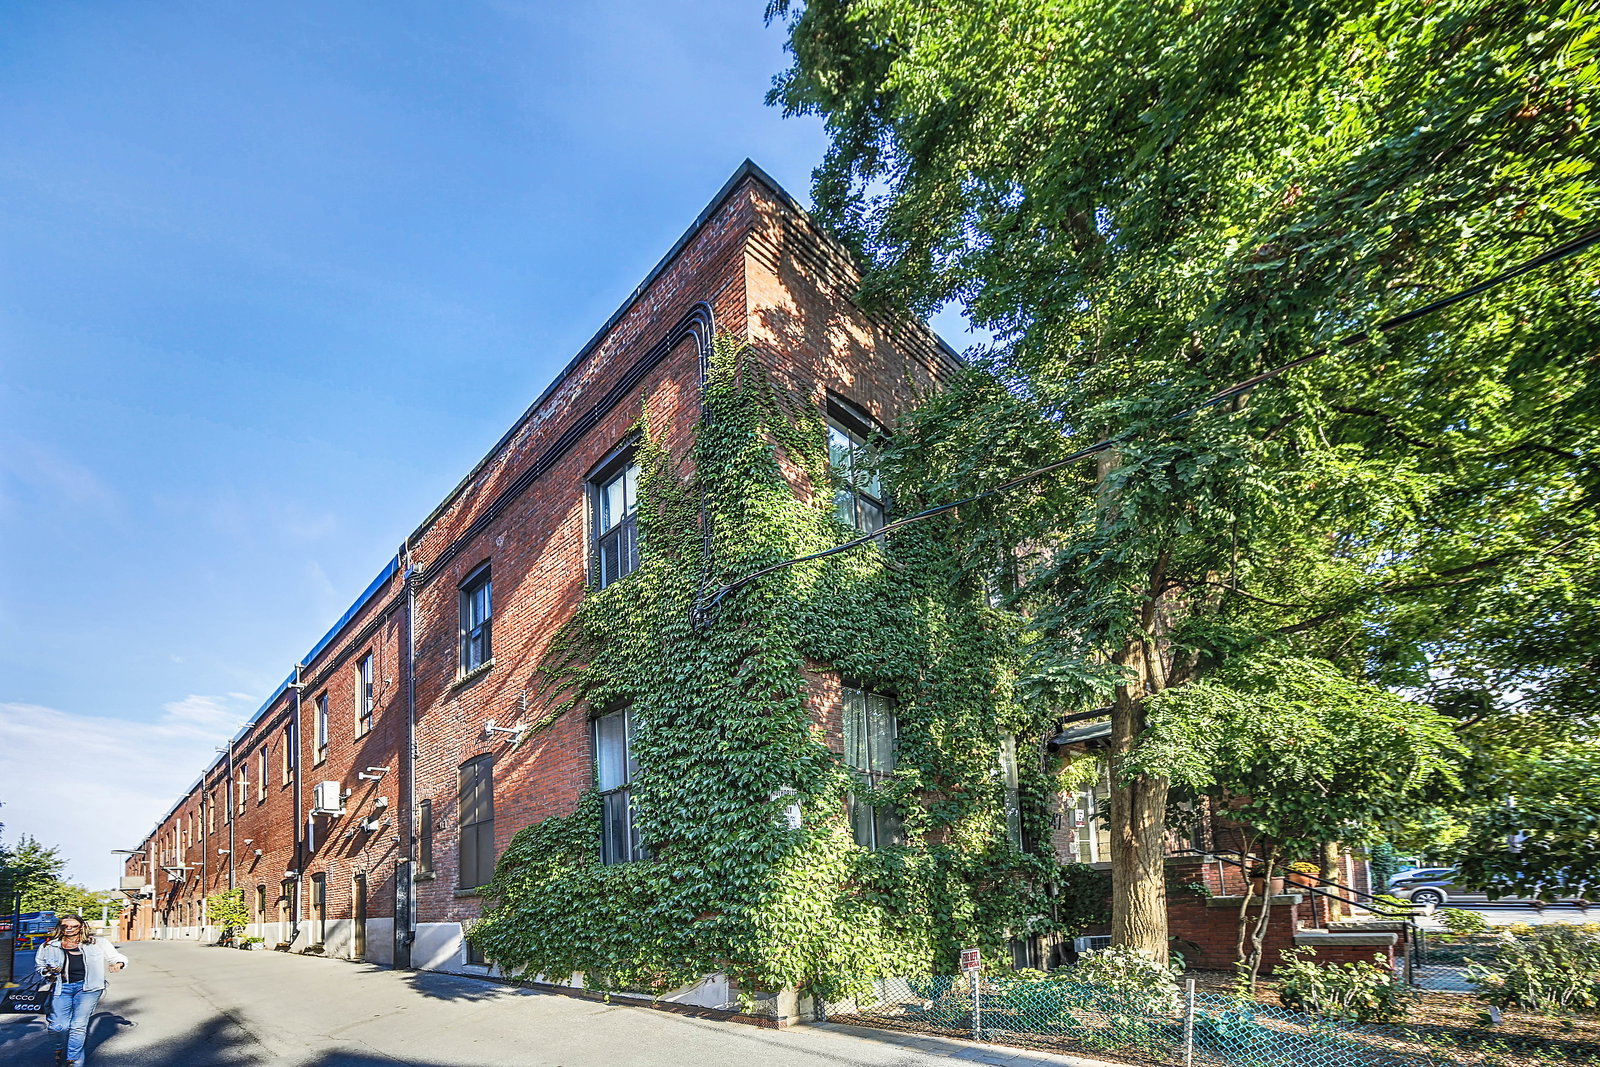
While the west end has gained popularity thanks to the rising prices of downtown Toronto condos, the Sorauren Lofts have in fact been home to residents for some time now. Renovated in 1999, the building at 347 Sorauren was one of the earliest loft conversions in the city.
The building’s past life may not be ultra-exciting to many: 347 Sorauren was originally home to a factory responsible for the creation of ball bearings. However, the industrial aesthetics that remain make for 48 impressive, and not to mention unique, homes.
As if to prove just how long this structure has been around, foliage wraps its way around the red brick façade. The classic industrial architecture is understated, nonchalant, and cool, although once inside the lofts tend to be quite dramatic thanks to their creative owners.
The Sorauren Lofts doesn’t necessarily cater to those looking for a one-stop-shop. Instead, the lack of amenities encourages active residents to go out and explore the expansive city that surrounds them. Certain lofts at 347 Sorauren do, however, come equipped with parking spaces, while others boast direct access to Sorauren Park from ground floor patios. Anyone lucky enough to score a unit with an outdoor space can also make use of gas hook-ups for barbecues (and those who aren’t so lucky are encouraged to make friends with these neighbours).
Being as intimate as it is, the Sorauren Lofts rarely appear on the market. Between everything mentioned earlier, as well as a pet-friendly attitude and a live/work zoning, the desirability of 347 Sorauren should simply come as no surprise.
Developer
Mel Brown
Year Built
1997
Property Type
Loft
Storeys
2
Total Units
48
Management
Icon Property Management
Security System
Party Room
Bike Storage
—
Avg $/sqft
-17.2%
YoY change
67
Avg days on market
Walk Score
88/100
Daily errands on foot
Transit Score
100/100
TTC, GO, subway access
Bike Score
75/100
Bike lanes & infrastructure
Neighbourhood in Toronto
Roncesvalles is a vibrant neighbourhood in Toronto known for its walkability and community feel. It offers a mix of parks, schools, and local shops.
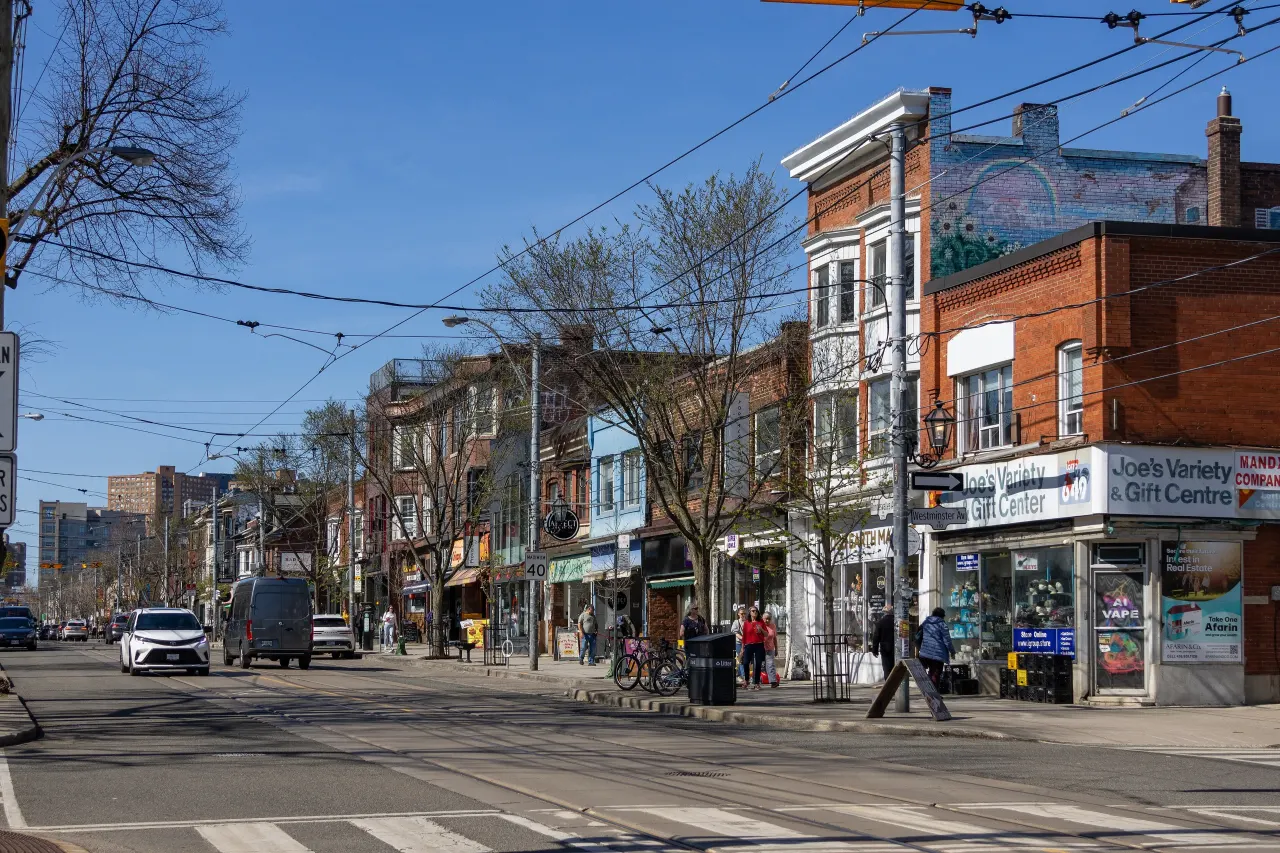
Toronto, Ontario
© Wikimedia Commons contributors (CC BY-SA)
Median asking price
In Ontario
$716,900
Median monthly rent
In Ontario
$2,499
For sale
0
For rent
0
Recently sold
Sign in to see sold data
Recently leased
Sign in to see leased data
Market data as of 2026-08-16. Sold and leased figures are neighbourhood medians over the last 12 months, published only where at least 5 homes closed — never a single sale.
What people love
Keep in mind
Daily life in Roncesvalles is active and community-focused, with plenty of local amenities. Residents enjoy easy access to parks and shops.
The boundary
1.5 km²
Every count and every census figure on this page was measured inside this line — not within a circle drawn around a centre point.
11
Parks
15
Playgrounds
26
Transit stations
10
Grocery stores
51
Restaurants
29
Cafés
7
Gyms
7
Pharmacies
Counted across all 1.5 km² of Roncesvalles. From OpenStreetMap, as of 2026-10-26.
5.6/10
Average rating of the 4 rated schools in this area
3
Elementary
1
Secondary
St Vincent de Paul Catholic School
Catholic · Grades JK–8 · Toronto CDSB
150th of 3,045 Ontario elementary schools
260 students · EQAO 2024-2025
Fern Avenue Junior and Senior Public School
Public · Grades JK–8 · Toronto DSB
1,026th of 3,045 Ontario elementary schools
675 students · EQAO 2024-2025
Bishop Marrocco/Thomas Merton Catholic Secondary School
Catholic · Grades 9–12 · Toronto CDSB
633rd of 742 Ontario secondary schools
775 students · EQAO 2024-2025
Parkdale Junior and Senior Public School
Public · Grades JK–8 · Toronto DSB
2,895th of 3,045 Ontario elementary schools
465 students · EQAO 2024-2025
Ontario Ministry of Education school registry; ratings from the Fraser Institute report card. These are the schools that stand inside Roncesvalles, not a catchment — most Ontario boards do not publish attendance boundaries, and we will not draw a line we cannot source. Confirm enrolment with the school board before you buy.
14,725
Population (2021)
1.5 km²
Area
9,739
People per km²
40.2
Median age
$98,303
Median income
47%
Own their home
2.2
People per household
6,790
Households
Every age
What is built here
Own or rent
47%Owners
53%Renters
Across 6,790 households
When it was built
Mostly 1960 or earlier
Share of occupied homes, by the era they were built in. Bars are drawn against the busiest era, not against each other, because the eras are not the same length. The eight shares are unlikely to total exactly 100: Statistics Canada rounds each era's count to the nearest 5 before publishing it, so we print what the census reports rather than adjusting a figure to make the column add up.
Statistics Canada, Census of Population 2021. Added up from 27 census areas inside the boundary. Medians and rates are a population-weighted average of dissemination-area figures.
Sources: HOMEH listings, Statistics Canada, Census of Population 2021, OpenStreetMap, HOMEH school registry, Photo: © Wikimedia Commons contributors (CC BY-SA)