Year Built
2000
by Bob Mitchell
525 Logan Avenue, Toronto, ON M4K3B3
Year Built
2000
Total Units
12
Storeys
2
0
Units for sale
0
Units for rent
Live MLS · Updated daily
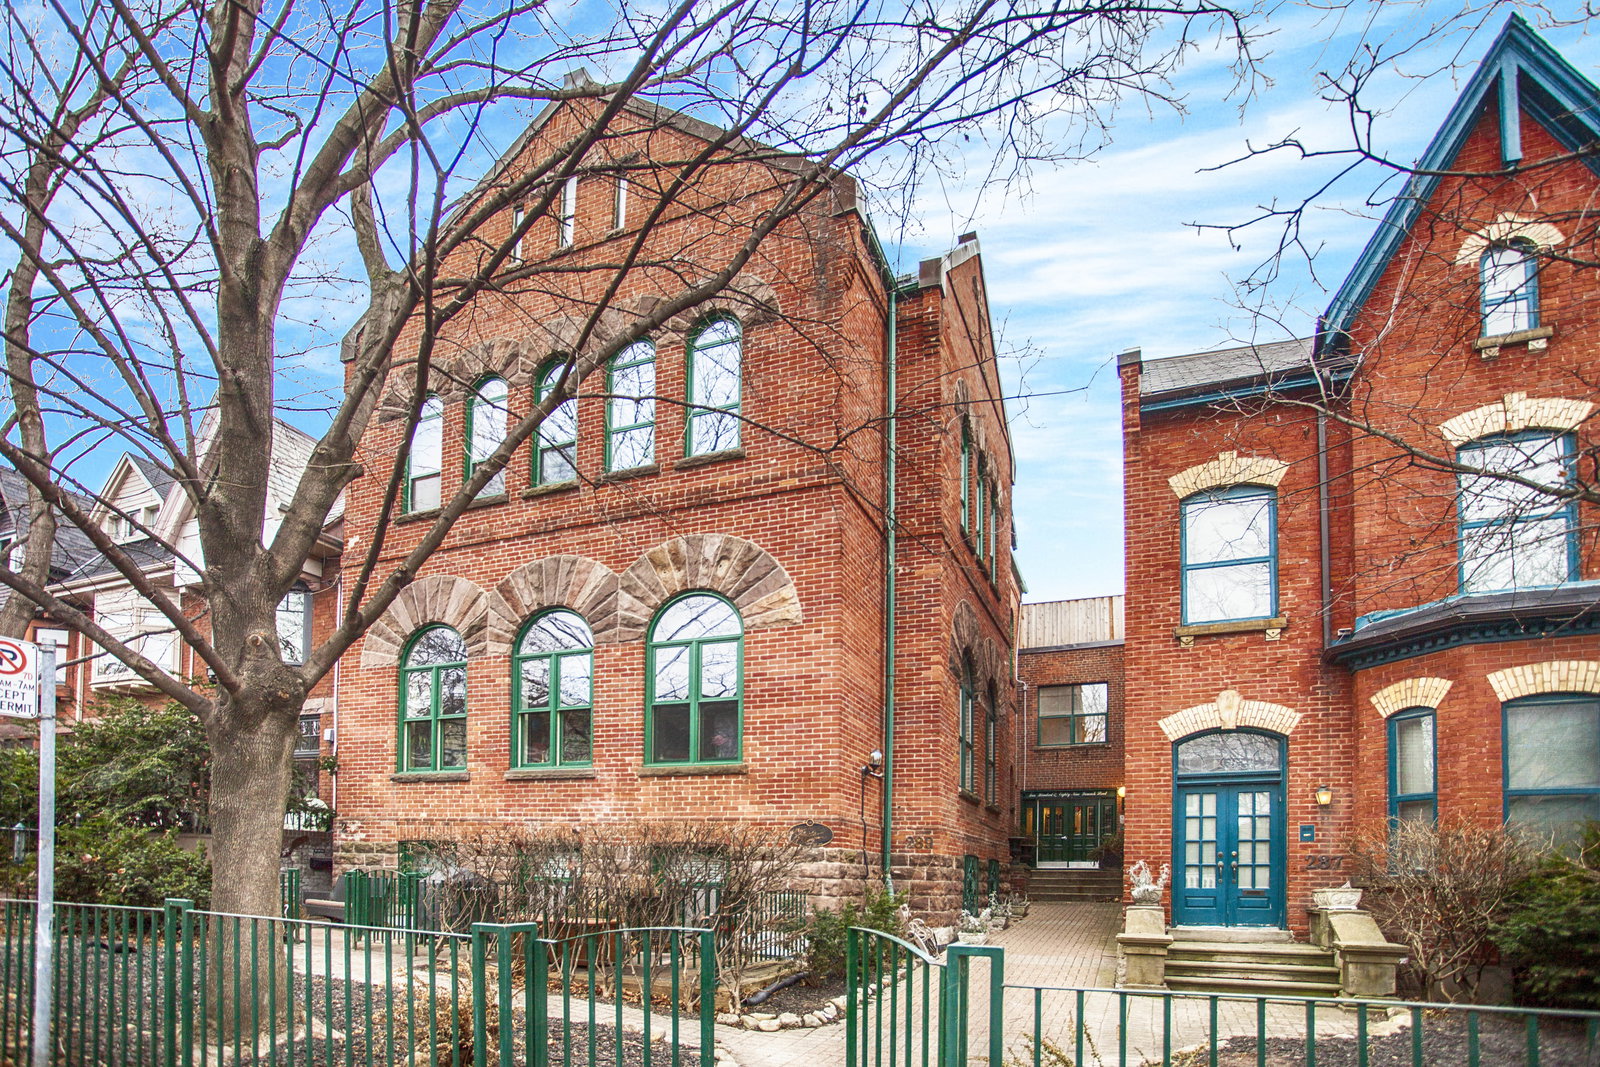
Trying to find authentic Toronto lofts in Leslieville & South Riverdale can be something akin to searching for a needle in a haystack. Fortunately, the hard lofts at 525 Logan Avenue are here to assist anyone searching for heritage and style within a charming, family friendly neighbourhood.
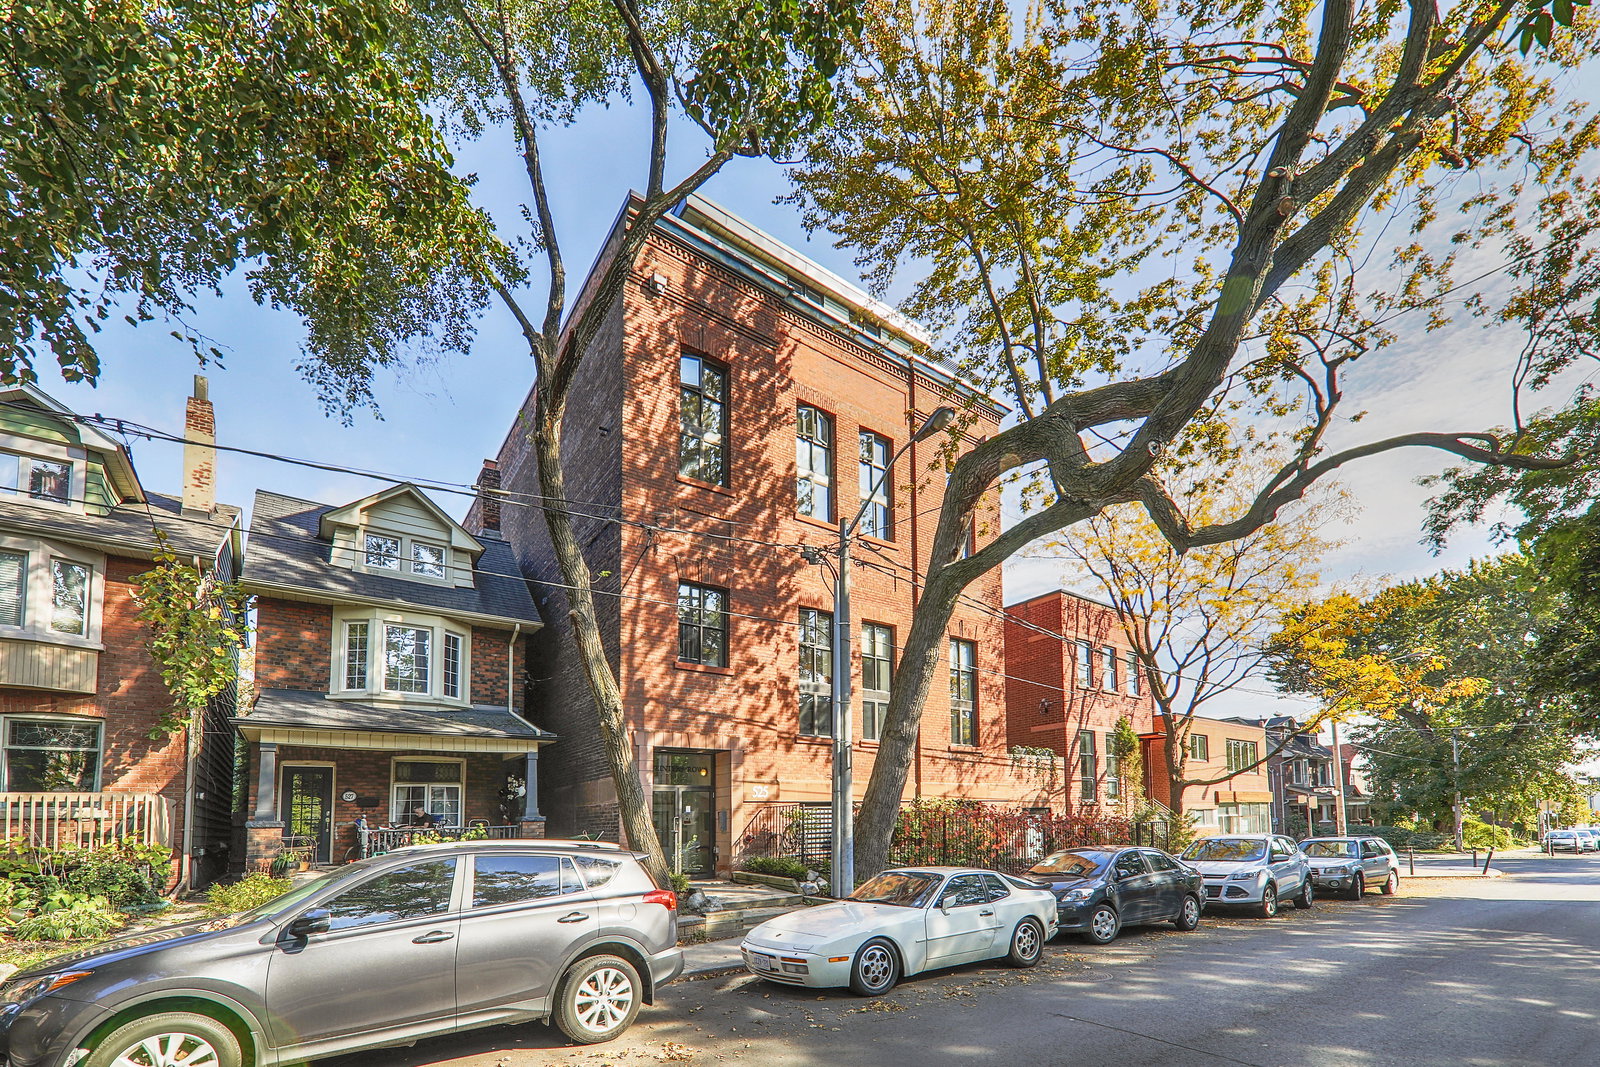
The Printers Row Lofts is not merely a loft to be settled on, however. These 12 homes, set within a historic frame, were designed by award winning developer Bob Mitchell of Mitchell Lofts. Built in 1911 by architect W.F. Carmichael, the traditional, rectangular red brick structure at 525 Logan Avenue was originally home to the headquarters of Bell Telephone.
The building was later repurposed, functioning as a printing press churching out plans for ABSO Blueprints. It was not until 2001 that Mitchell had his shot at carving character-rich yet updated homes out of the existing structure. The result was like a breath of fresh air for the neighbourhood — 12 modish hard lofts appeared amidst a myriad of single- and semi-detached homes. Upon its completion, Toronto Star architecture critic Christopher Hume even granted the Printers Row Lofts an A rating.
Developer
Bob Mitchell
Year Built
2000
Property Type
Loft
Storeys
2
Total Units
12
Management
360 Community Management Ltd.
BBQ Area
Bike Storage
—
Avg $/sqft
Steady
YoY change
—
Avg days on market
Walk Score
94/100
Daily errands on foot
Transit Score
98/100
TTC, GO, subway access
Bike Score
65/100
Bike lanes & infrastructure
City in Ontario
Toronto is a large city in Ontario known for its diversity and vibrant culture. It offers a mix of residential and urban living with plenty of amenities.
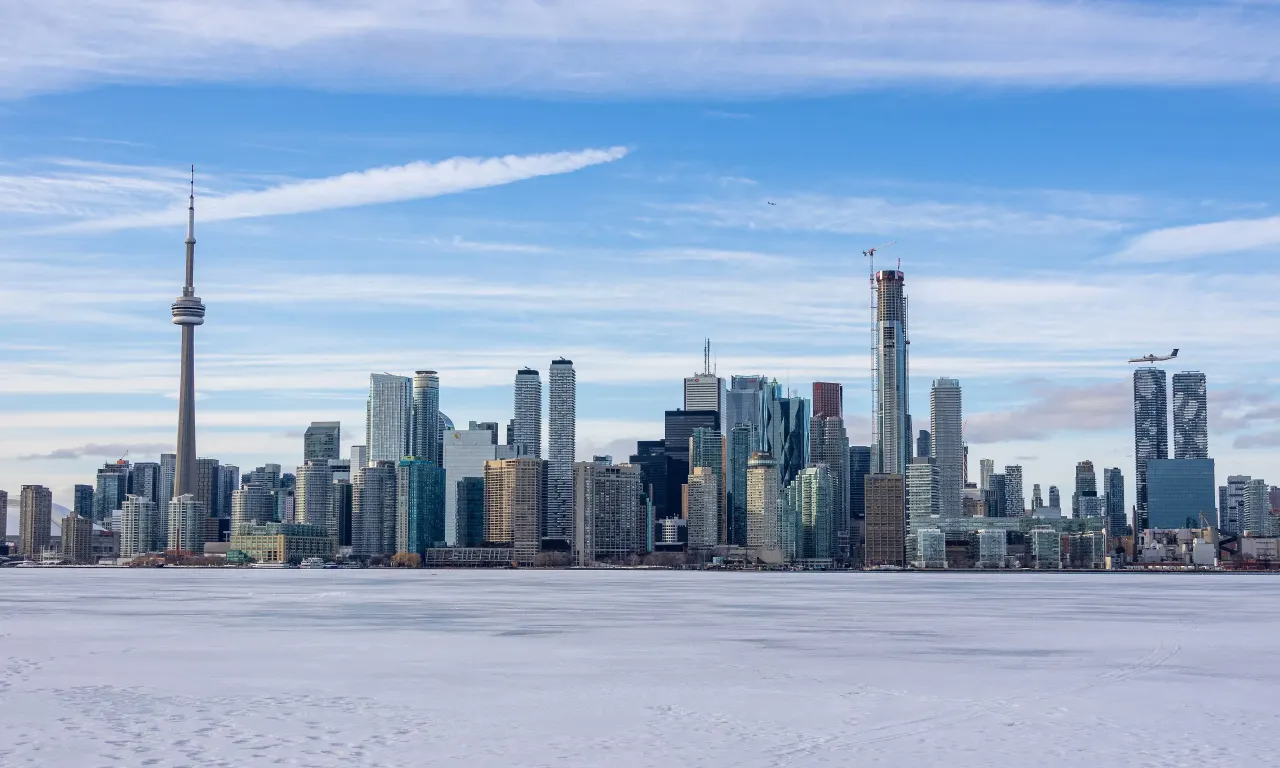
Toronto, Ontario
© Wikimedia Commons contributors (CC BY-SA)
93
Walkability
out of 100 · averaged over 215 past and present listings
Average walk score reported on listings here
6.4
Schools near listings
out of 10 · averaged over 215 past and present listings
Fraser Institute ratings within 2 km of each listing, closer schools weighted more
Each score is an average over this area's own listings and is shown only where at least 5 of them carry one. Scores are reported by listing agents, not measured by HOMEH.
Median asking price
$759,900
In Toronto
$759,900
In Ontario
$716,900
Median monthly rent
$2,600/mo
In Toronto
$2,600
In Ontario
$2,499
$1,085
Per square foot
≈ 24.4 years
Of rent to match the purchase price
For sale
4,328
Median $759,900
Condos 3,148 · Houses 1,179
For rent
4,513
Median $2,600
Recently sold
Sign in to see sold data
Recently leased
Sign in to see leased data
Market data as of 2026-08-16. Sold and leased figures are neighbourhood medians over the last 12 months, published only where at least 5 homes closed — never a single sale.
What people love
Keep in mind
Daily life in Toronto is busy and lively, with many activities and services available. The city has a mix of urban and suburban areas.
The boundary
661.4 km²
Every count and every census figure on this page was measured inside this line — not within a circle drawn around a centre point.
1,669
Parks
2,209
Playgrounds
1,015
Transit stations
586
Grocery stores
3,605
Restaurants
1,594
Cafés
536
Gyms
142
Libraries
700
Pharmacies
Counted across all 661.4 km² of Toronto. From OpenStreetMap, as of 2026-10-19.
6.4/10
Average rating of the 539 rated schools in this area
911
Elementary
325
Secondary
Avondale Alternative Elementary School
Public · Grades JK–8 · Toronto DSB
1st of 3,045 Ontario elementary schools
135 students · EQAO 2024-2025
Cottingham Junior Public School
Public · Grades JK–6 · Toronto DSB
1st of 3,045 Ontario elementary schools
140 students · EQAO 2024-2025
Northmount
Independent · TO Private Non-Inspected
1st of 3,045 Ontario elementary schools
18 students
Rosedale Junior Public School
Public · Grades JK–6 · Toronto DSB
1st of 3,045 Ontario elementary schools
220 students · EQAO 2024-2025
Sathya Sai
Independent · TO Private Non-Inspected
1st of 3,045 Ontario elementary schools
24 students
St Michael's Choir (Jr) School
Catholic · Grades 1–8 · Toronto CDSB
1st of 3,045 Ontario elementary schools
135 students · EQAO 2024-2025
Ontario Ministry of Education school registry; ratings from the Fraser Institute report card. These are the schools that stand inside Toronto, not a catchment — most Ontario boards do not publish attendance boundaries, and we will not draw a line we cannot source. Confirm enrolment with the school board before you buy.
2,794,356
Population (2021)
631.1 km²
Area
4,428
People per km²
41.2
Median age
$94,555
Median income
52%
Own their home
2.5
People per household
1,160,800
Households
Every age
What is built here
Own or rent
52%Owners
48%Renters
Across 1,160,800 households
When it was built
Mostly 1960 or earlier
Share of occupied homes, by the era they were built in. Bars are drawn against the busiest era, not against each other, because the eras are not the same length. The eight shares are unlikely to total exactly 100: Statistics Canada rounds each era's count to the nearest 5 before publishing it, so we print what the census reports rather than adjusting a figure to make the column add up.
Statistics Canada, Census of Population 2021. Added up from 3,743 census areas inside the boundary. Medians and rates are a population-weighted average of dissemination-area figures.
Sources: HOMEH listings, Statistics Canada, Census of Population 2021, OpenStreetMap, HOMEH school registry, Photo: © Wikimedia Commons contributors (CC BY-SA)