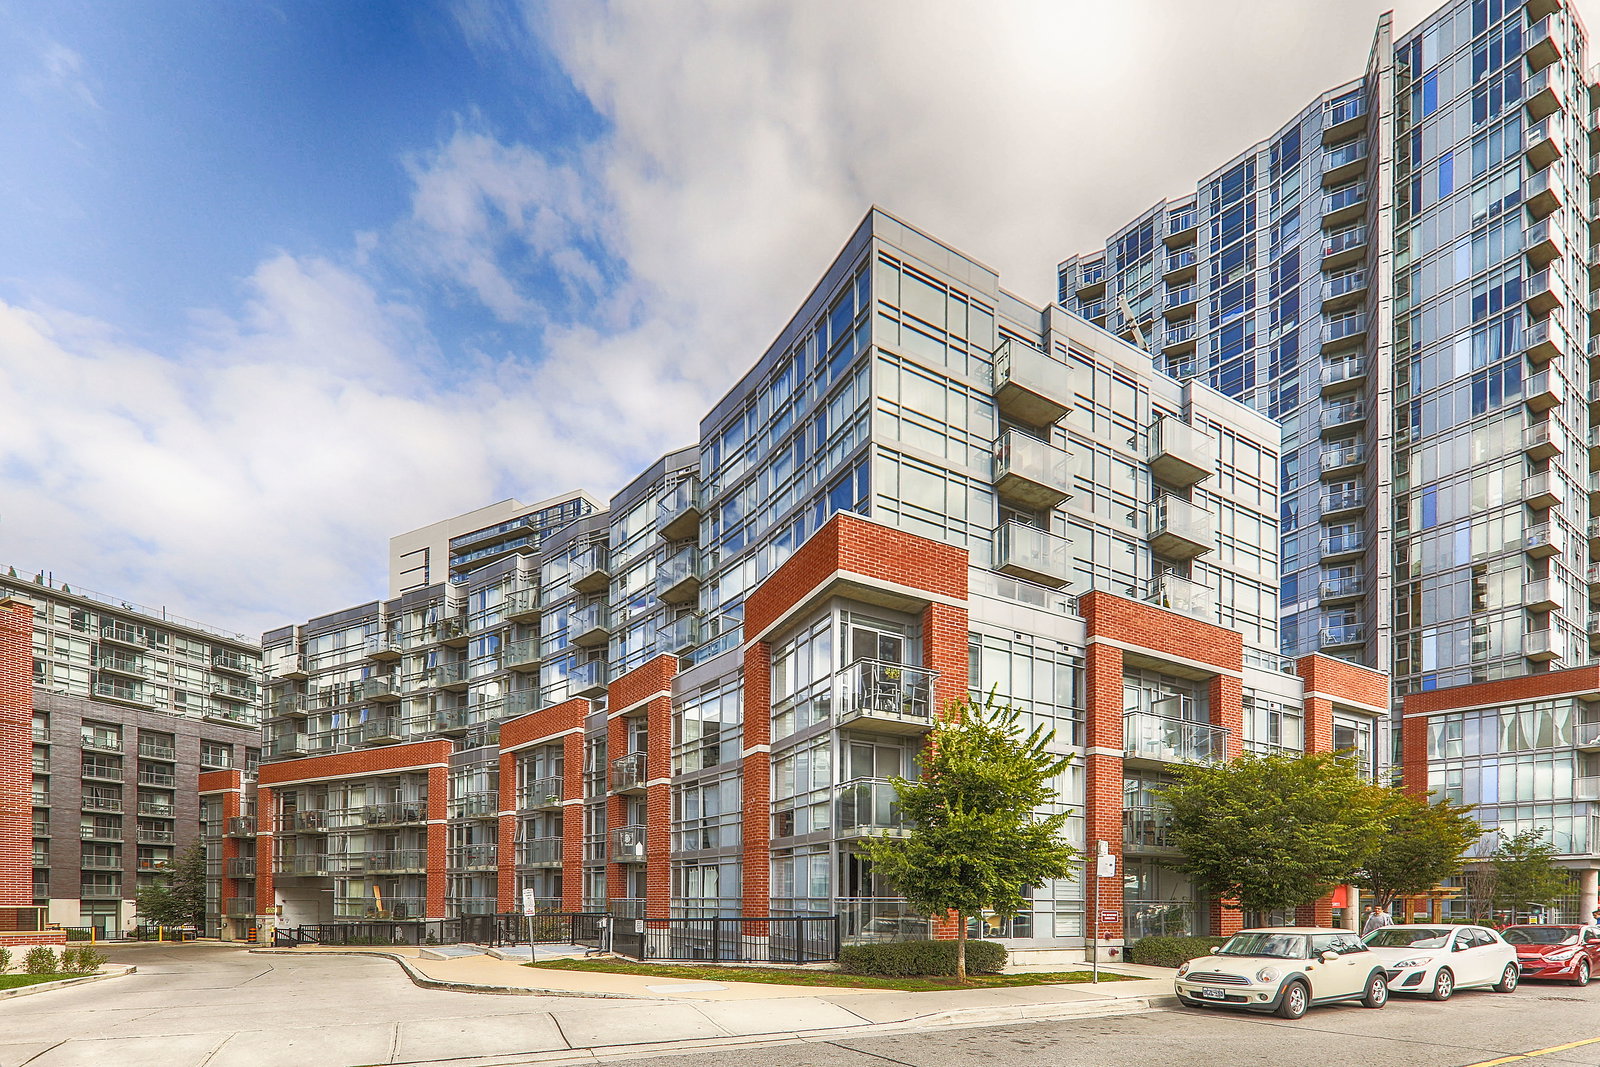
Year Built
2007
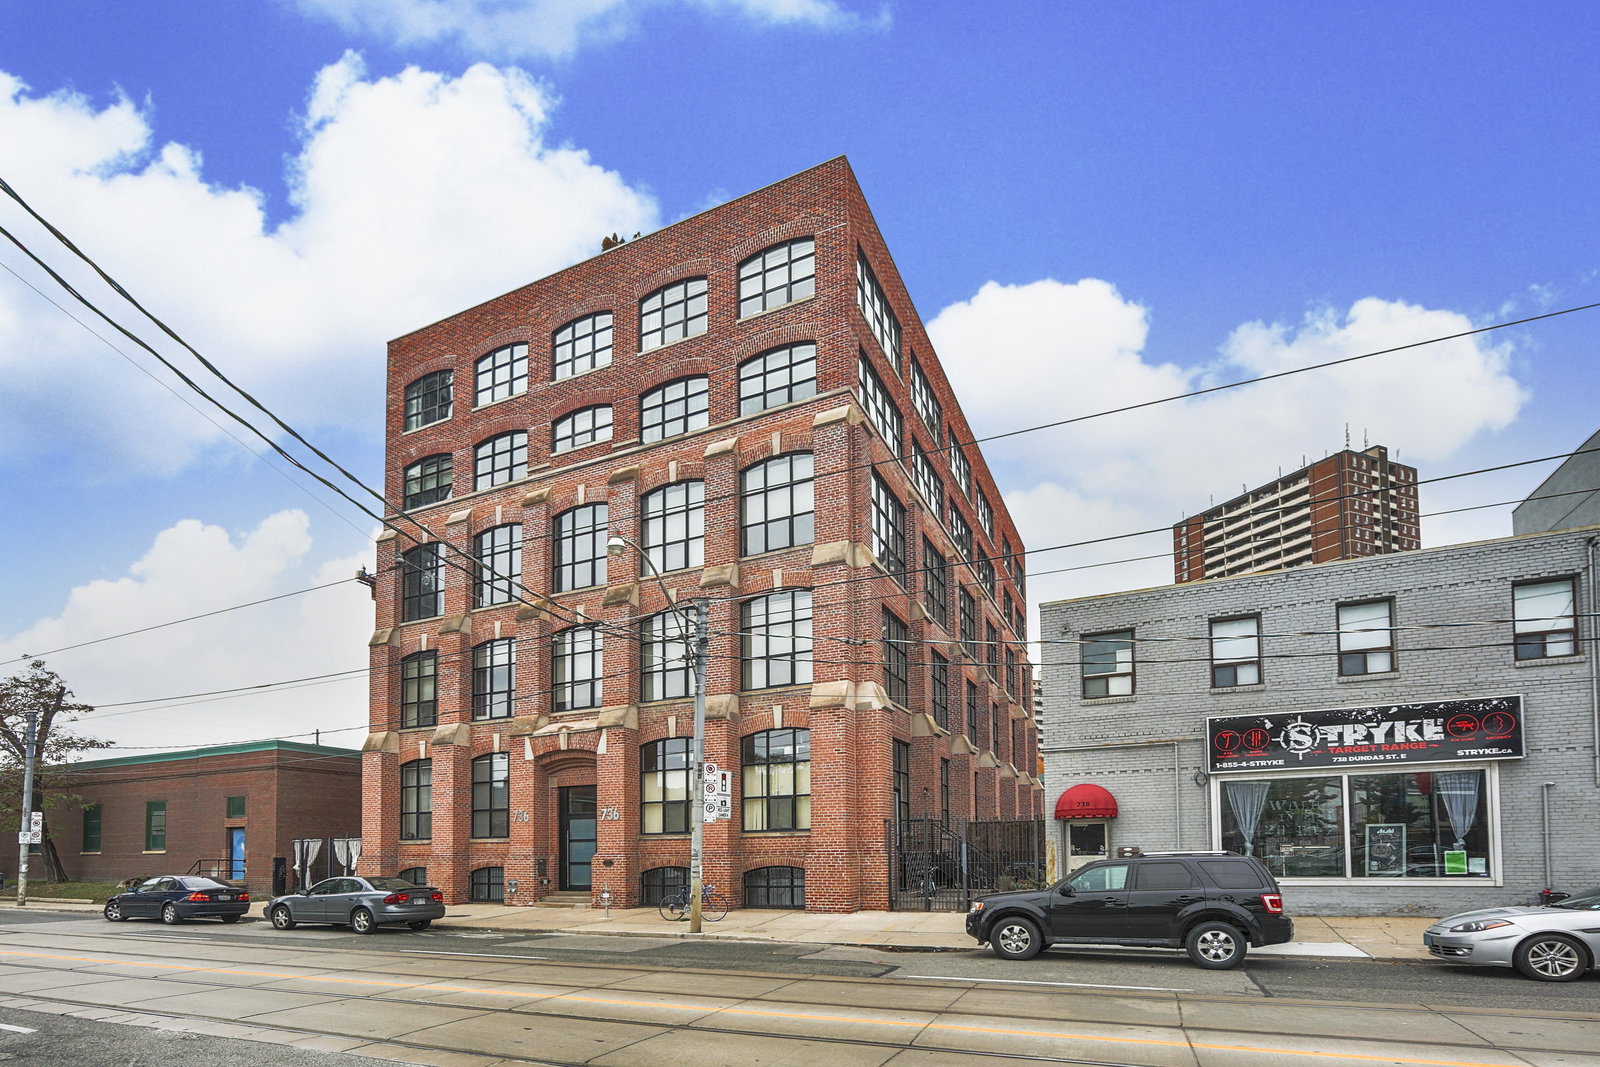
by Urbancorp Development
736 Dundas Street E, Toronto, ON M5A2C3
Year Built
2007
Total Units
40
Avg $/sqft
$803
Storeys
7
0
Units for sale
1
Unit for rent
From $3,650/mo
Live MLS · Updated daily
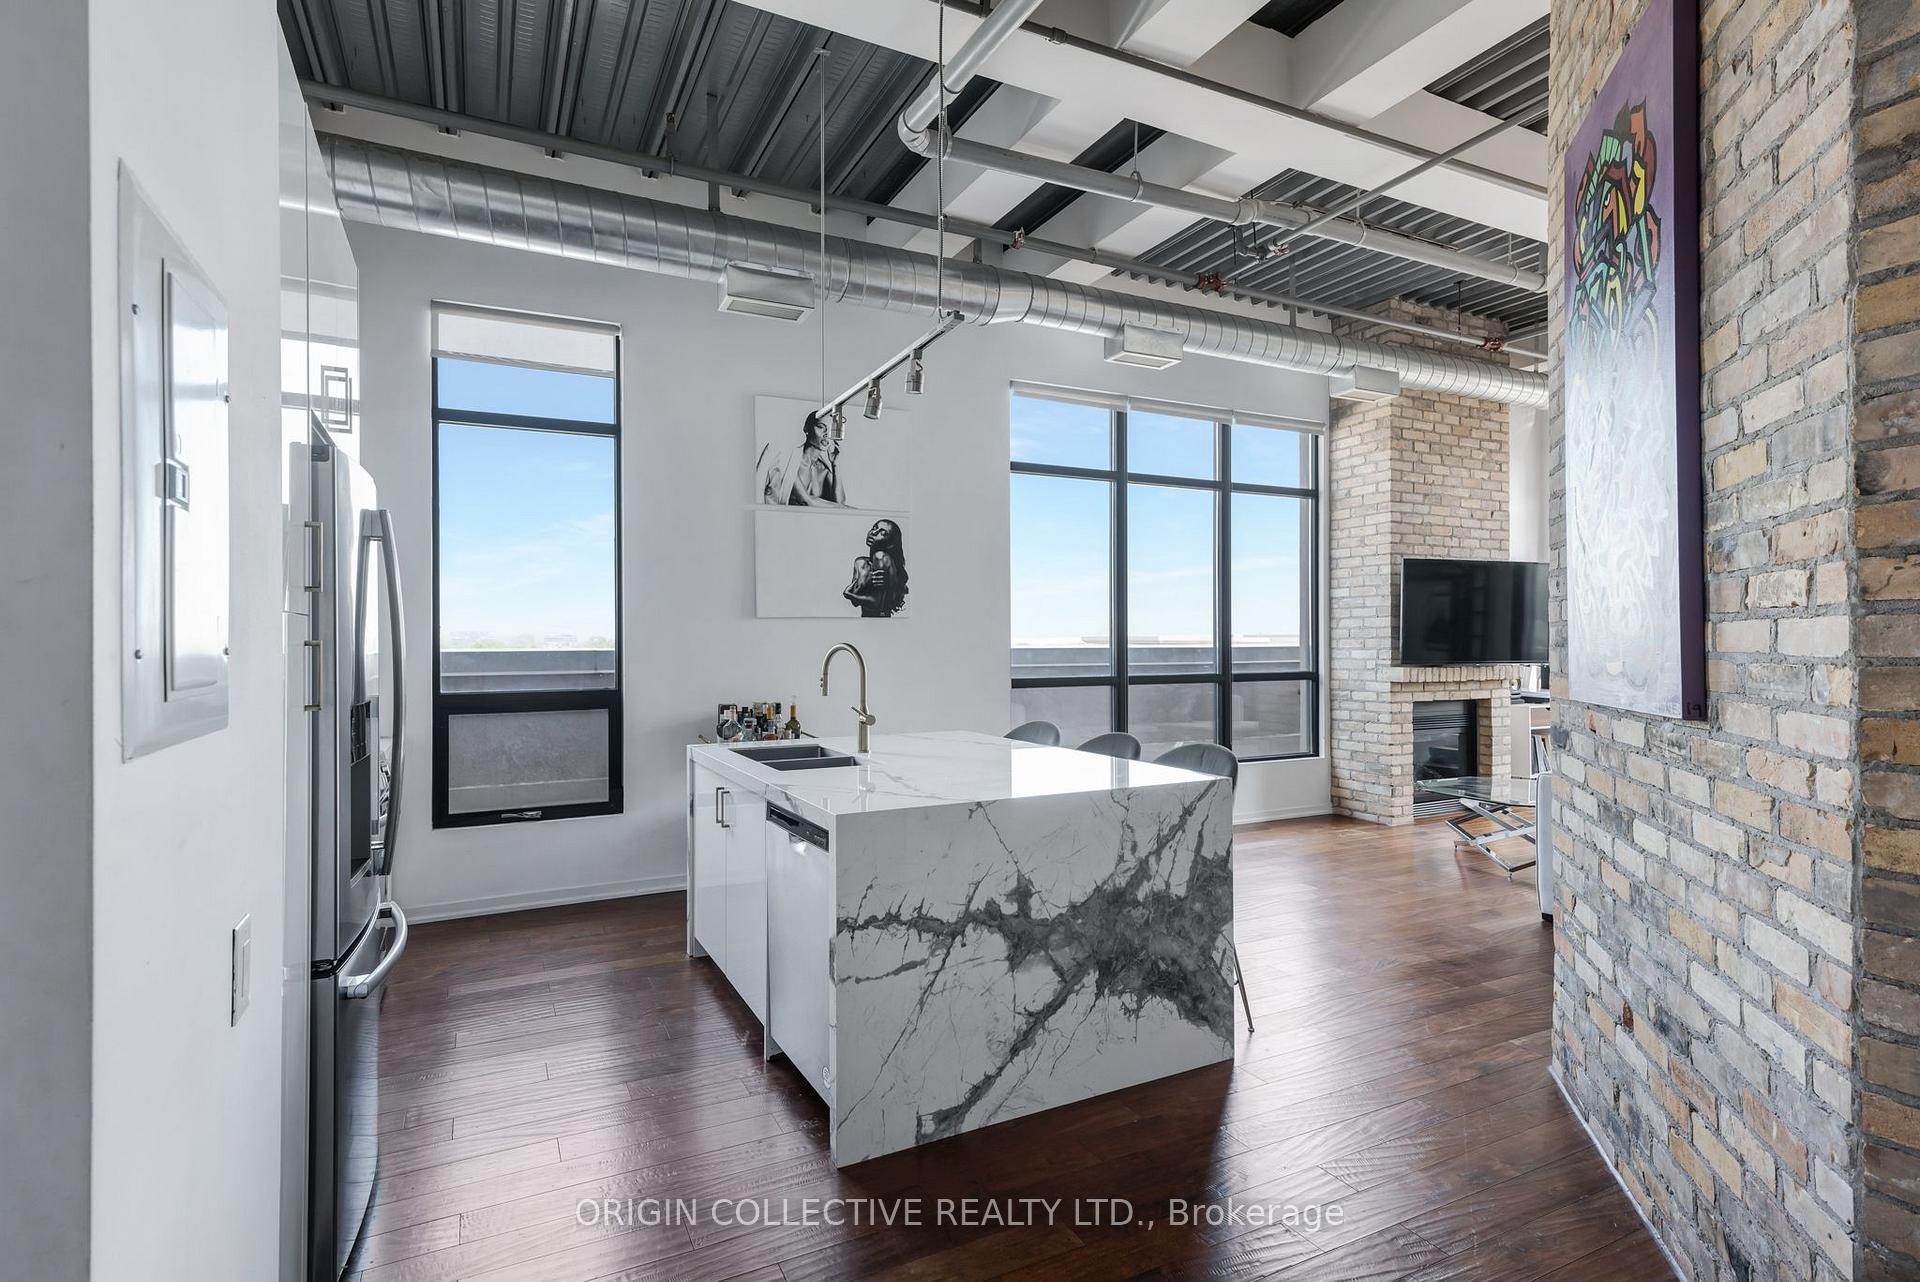
Anyone who becomes elated by that new car smell will feel very much at home at 736 Dundas Street East. Conversely, scents from these lofts’ days as a tannery are nowhere to be found, because the structure was never actually used to produce leather. Instead, the name given to the Tannery Lofts might simply be a ploy to evoke thoughts of Toronto’s industrial history.
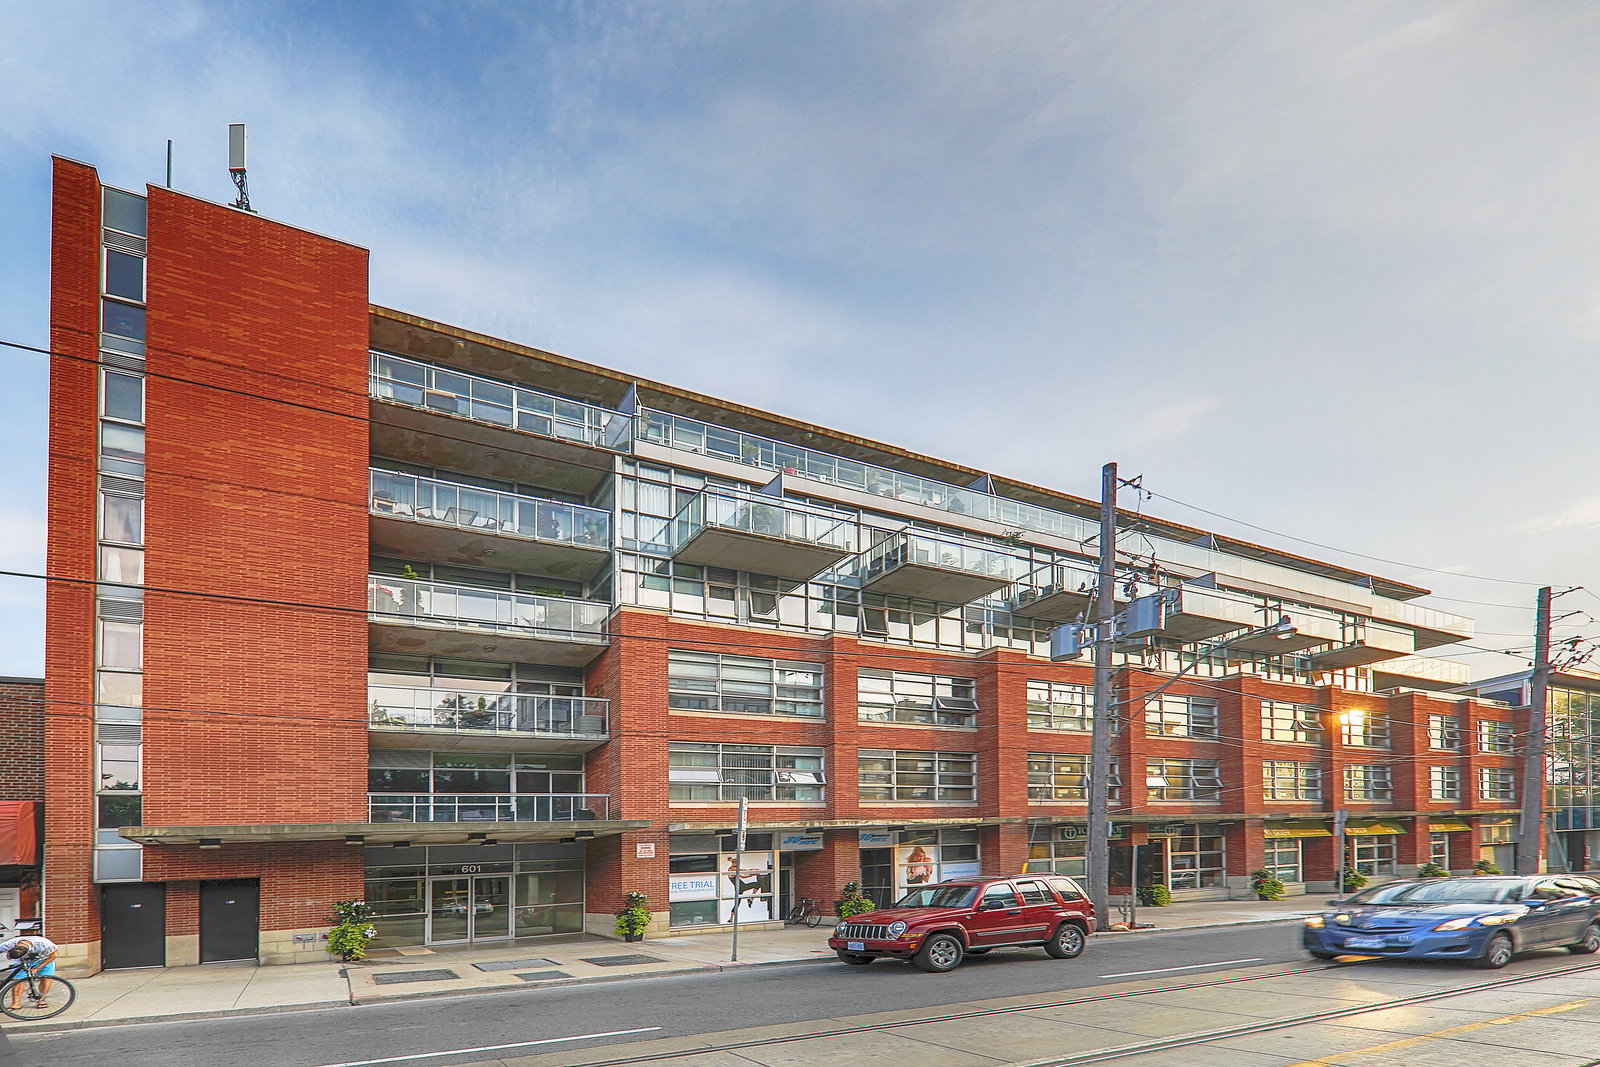
The building at 736 Dundas East has, however, functioned as some sort of factory since its construction in 1913. Before being converted to Toronto lofts in 2007, this building was home to the Adam Beck Cigar Box Manufacturing Company. As of late, the structure has obtained its status as a heritage building, for its historical implication as well as its architectural style.
As more than simply a designer of structures, Lyle once helped to advance entire cities as well. The architect and urban planner was an active constituent of the City Beautiful Movement, a late 19th century attempt to revamp the aesthetics of North American cities. Most notably for Torontonians, Lyle was the architect behind the Royal Alexandra Theatre on King Street West.
Today, 45 homes known as the Tannery Lofts inhabit Lyle’s early 20th century construction at 736 Dundas East. This intimate group of hard lofts span 7 storeys, making for a truly boutique feel. Turn of the century industrial masonry, spread with slightly curved warehouse windows, offers a character-rich backdrop for contemporary homeowners to make a life in.
And while there may be no crazy maintenance fees here, the catch is a similar lack of amenities. Many resourceful urbanites can get by without common services built right in, however for others this might be a strike against the development.
Developer
Urbancorp Development
Year Built
2007
Property Type
Low-Rise Condo
Storeys
7
Total Units
40
Management
Taft Forward Property Management Group
Security System
$803
Avg $/sqft
-17.2%
YoY change
43
Avg days on market
Walk Score
80/100
Daily errands on foot
Transit Score
99/100
TTC, GO, subway access
Bike Score
72/100
Bike lanes & infrastructure
Neighbourhood in Toronto
Regent Park is a vibrant neighbourhood in Toronto known for its walkability and community spirit. It offers a mix of residential and recreational spaces, making it a great place to live.
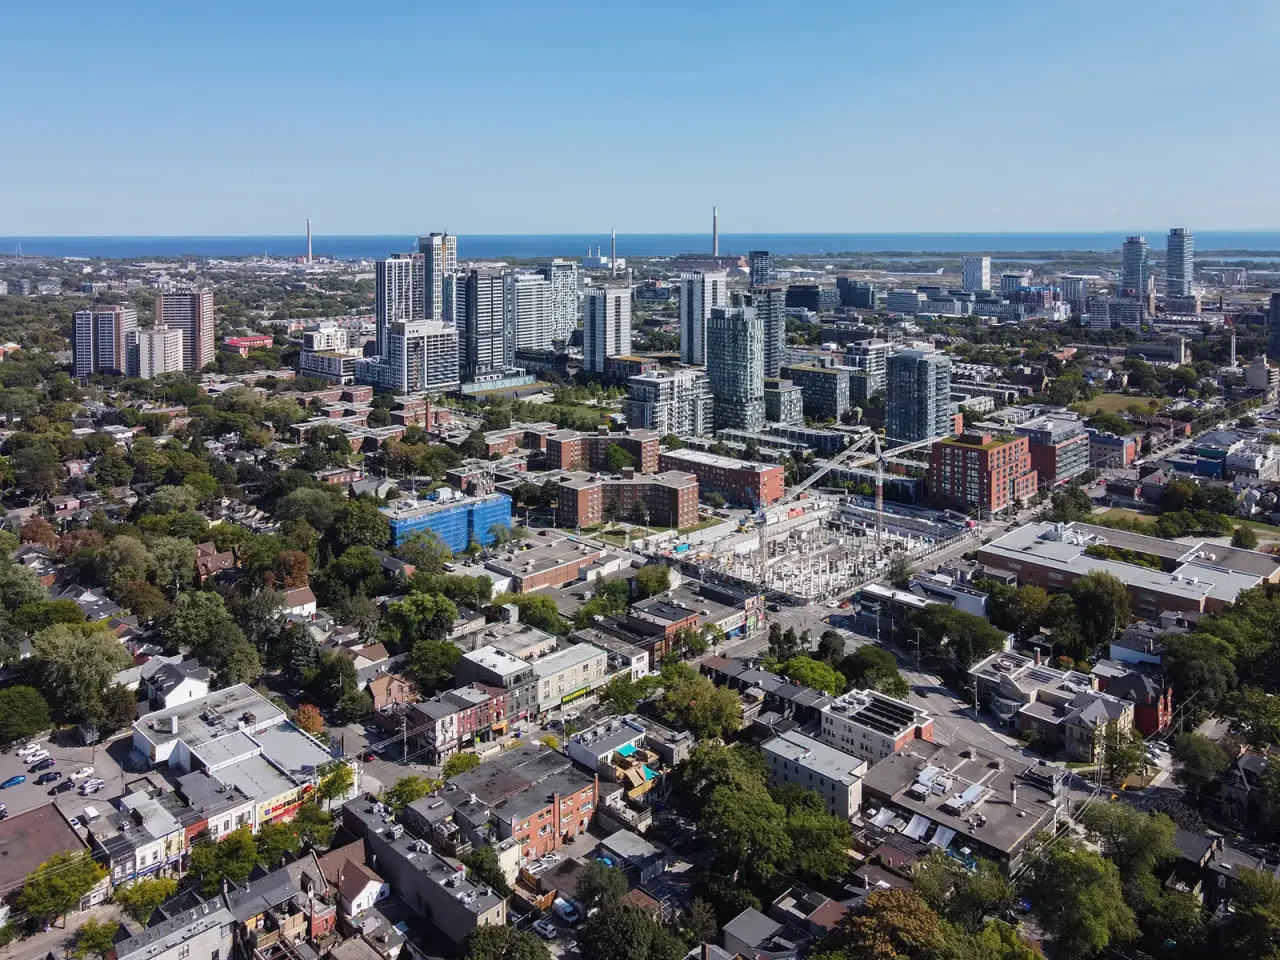
Toronto, Ontario
© Wikimedia Commons contributors (CC BY-SA)
Median asking price
In Ontario
$716,900
Median monthly rent
In Ontario
$2,499
For sale
0
For rent
0
Recently sold
Sign in to see sold data
Recently leased
Sign in to see leased data
Market data as of 2026-08-16. Sold and leased figures are neighbourhood medians over the last 12 months, published only where at least 5 homes closed — never a single sale.
What people love
Keep in mind
Daily life in Regent Park is active and community-oriented, with easy access to local services.
The boundary
0.7 km²
Every count and every census figure on this page was measured inside this line — not within a circle drawn around a centre point.
4
Parks
10
Playgrounds
17
Transit stations
2
Grocery stores
12
Restaurants
7
Cafés
1
Gyms
3
Pharmacies
Counted across all 0.7 km² of Regent Park. From OpenStreetMap, as of 2026-10-12.
3.9/10
Average rating of the 1 rated school in this area
1
Elementary
1
Secondary
Nelson Mandela Park Public School
Public · Grades JK–8 · Toronto DSB
2,601st of 3,045 Ontario elementary schools
385 students · EQAO 2024-2025
June Callwood CentreforWomenandFamilies
Public · Grades 9–12 · Toronto DSB
Not rated
Ontario Ministry of Education school registry; ratings from the Fraser Institute report card. These are the schools that stand inside Regent Park, not a catchment — most Ontario boards do not publish attendance boundaries, and we will not draw a line we cannot source. Confirm enrolment with the school board before you buy.
12,797
Population (2021)
0.6 km²
Area
20,027
People per km²
35.9
Median age
$67,113
Median income
29%
Own their home
2.2
People per household
6,110
Households
Every age
What is built here
Own or rent
29%Owners
71%Renters
Across 6,110 households
When it was built
Mostly 2016–2021
Share of occupied homes, by the era they were built in. Bars are drawn against the busiest era, not against each other, because the eras are not the same length. The eight shares are unlikely to total exactly 100: Statistics Canada rounds each era's count to the nearest 5 before publishing it, so we print what the census reports rather than adjusting a figure to make the column add up.
Statistics Canada, Census of Population 2021. Added up from 13 census areas inside the boundary. Medians and rates are a population-weighted average of dissemination-area figures.
Sources: HOMEH listings, Statistics Canada, Census of Population 2021, OpenStreetMap, HOMEH school registry, Photo: © Wikimedia Commons contributors (CC BY-SA)