Year Built
2011
by Lanterra Developments
215 Fort York Boulevard, Toronto, ON M5V 4A2
Year Built
2011
Total Units
861
Avg $/sqft
$802
Storeys
38
7
Units for sale
From $359,900
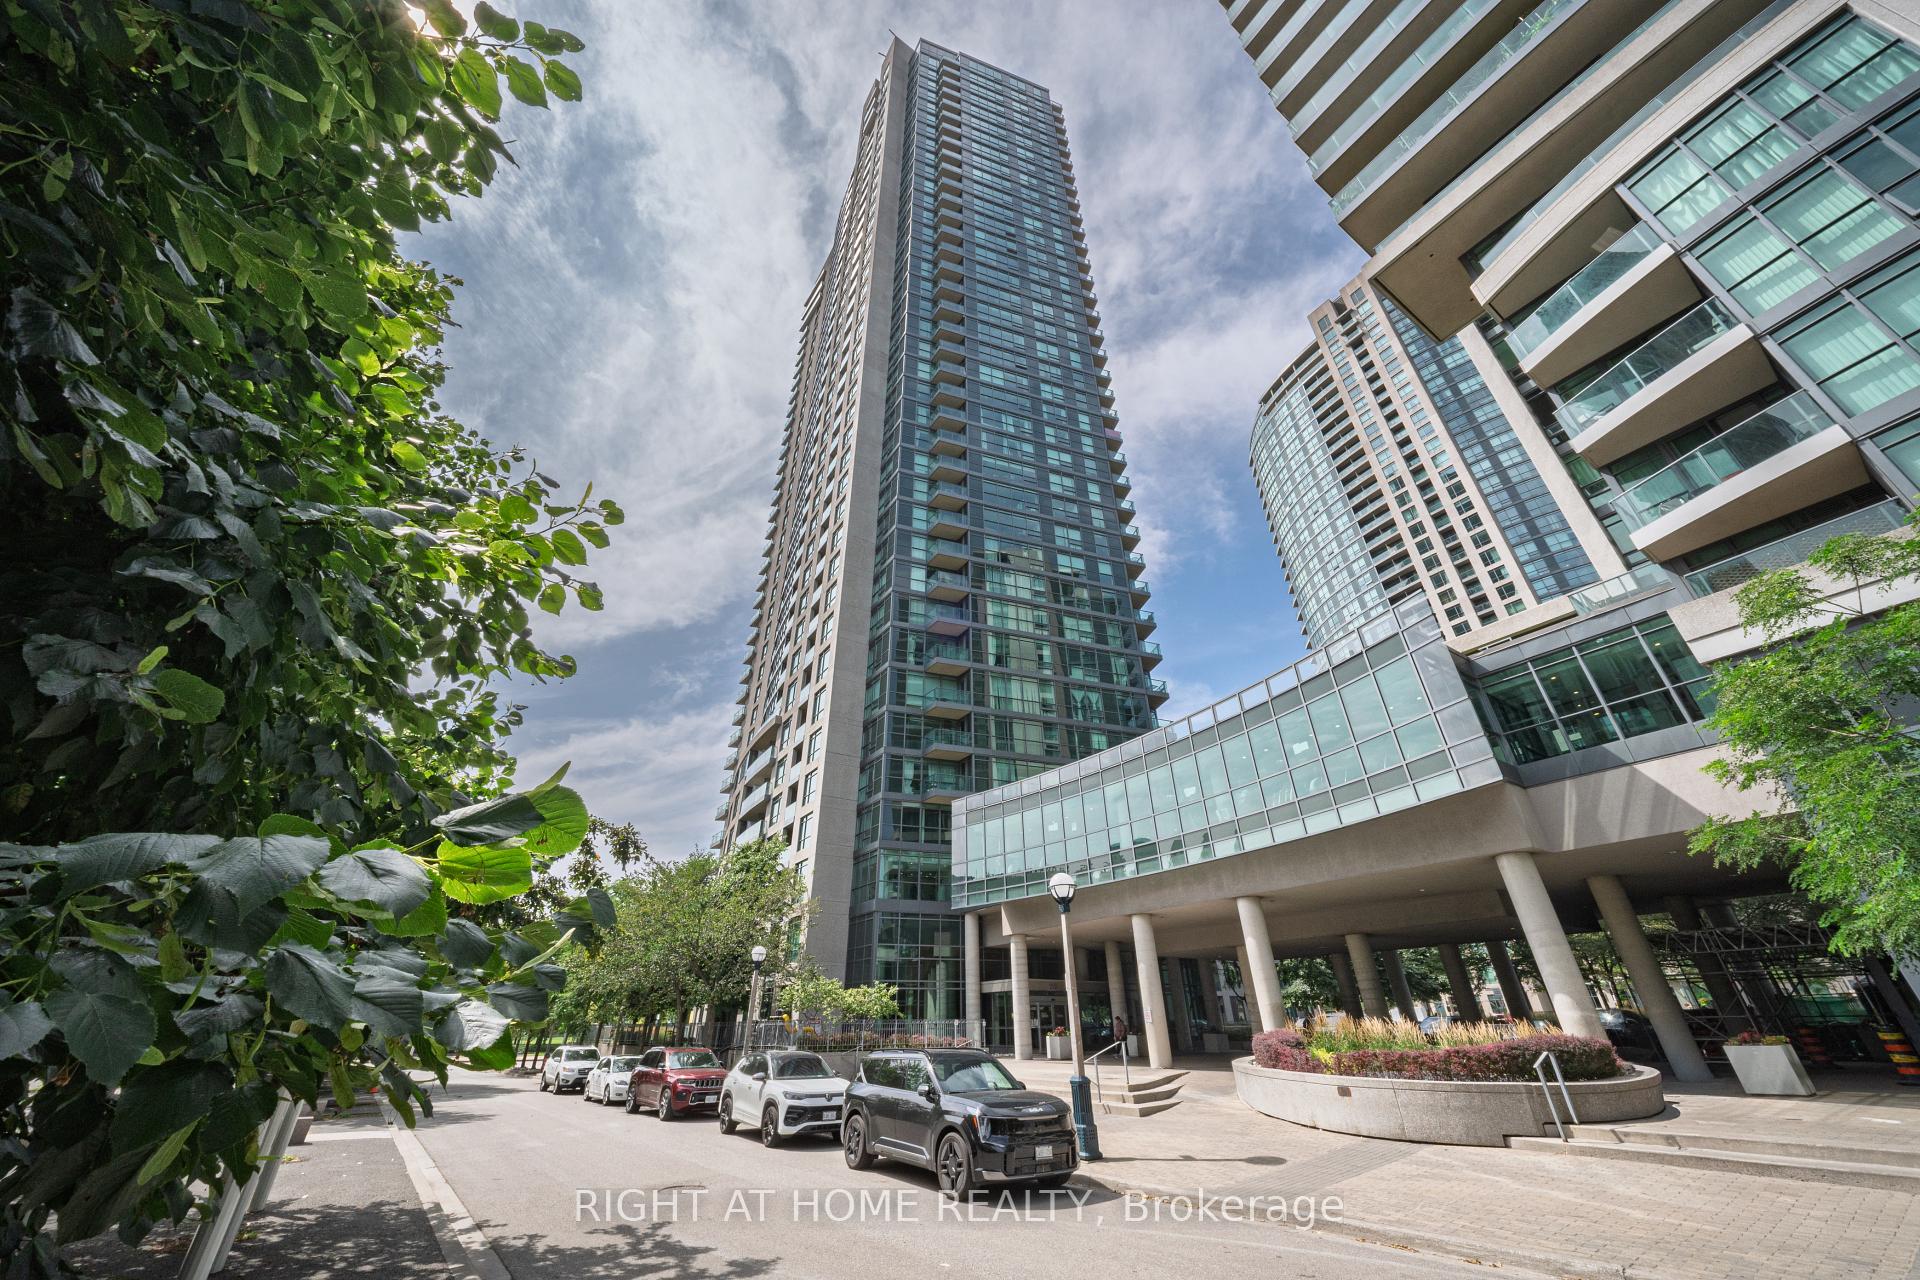
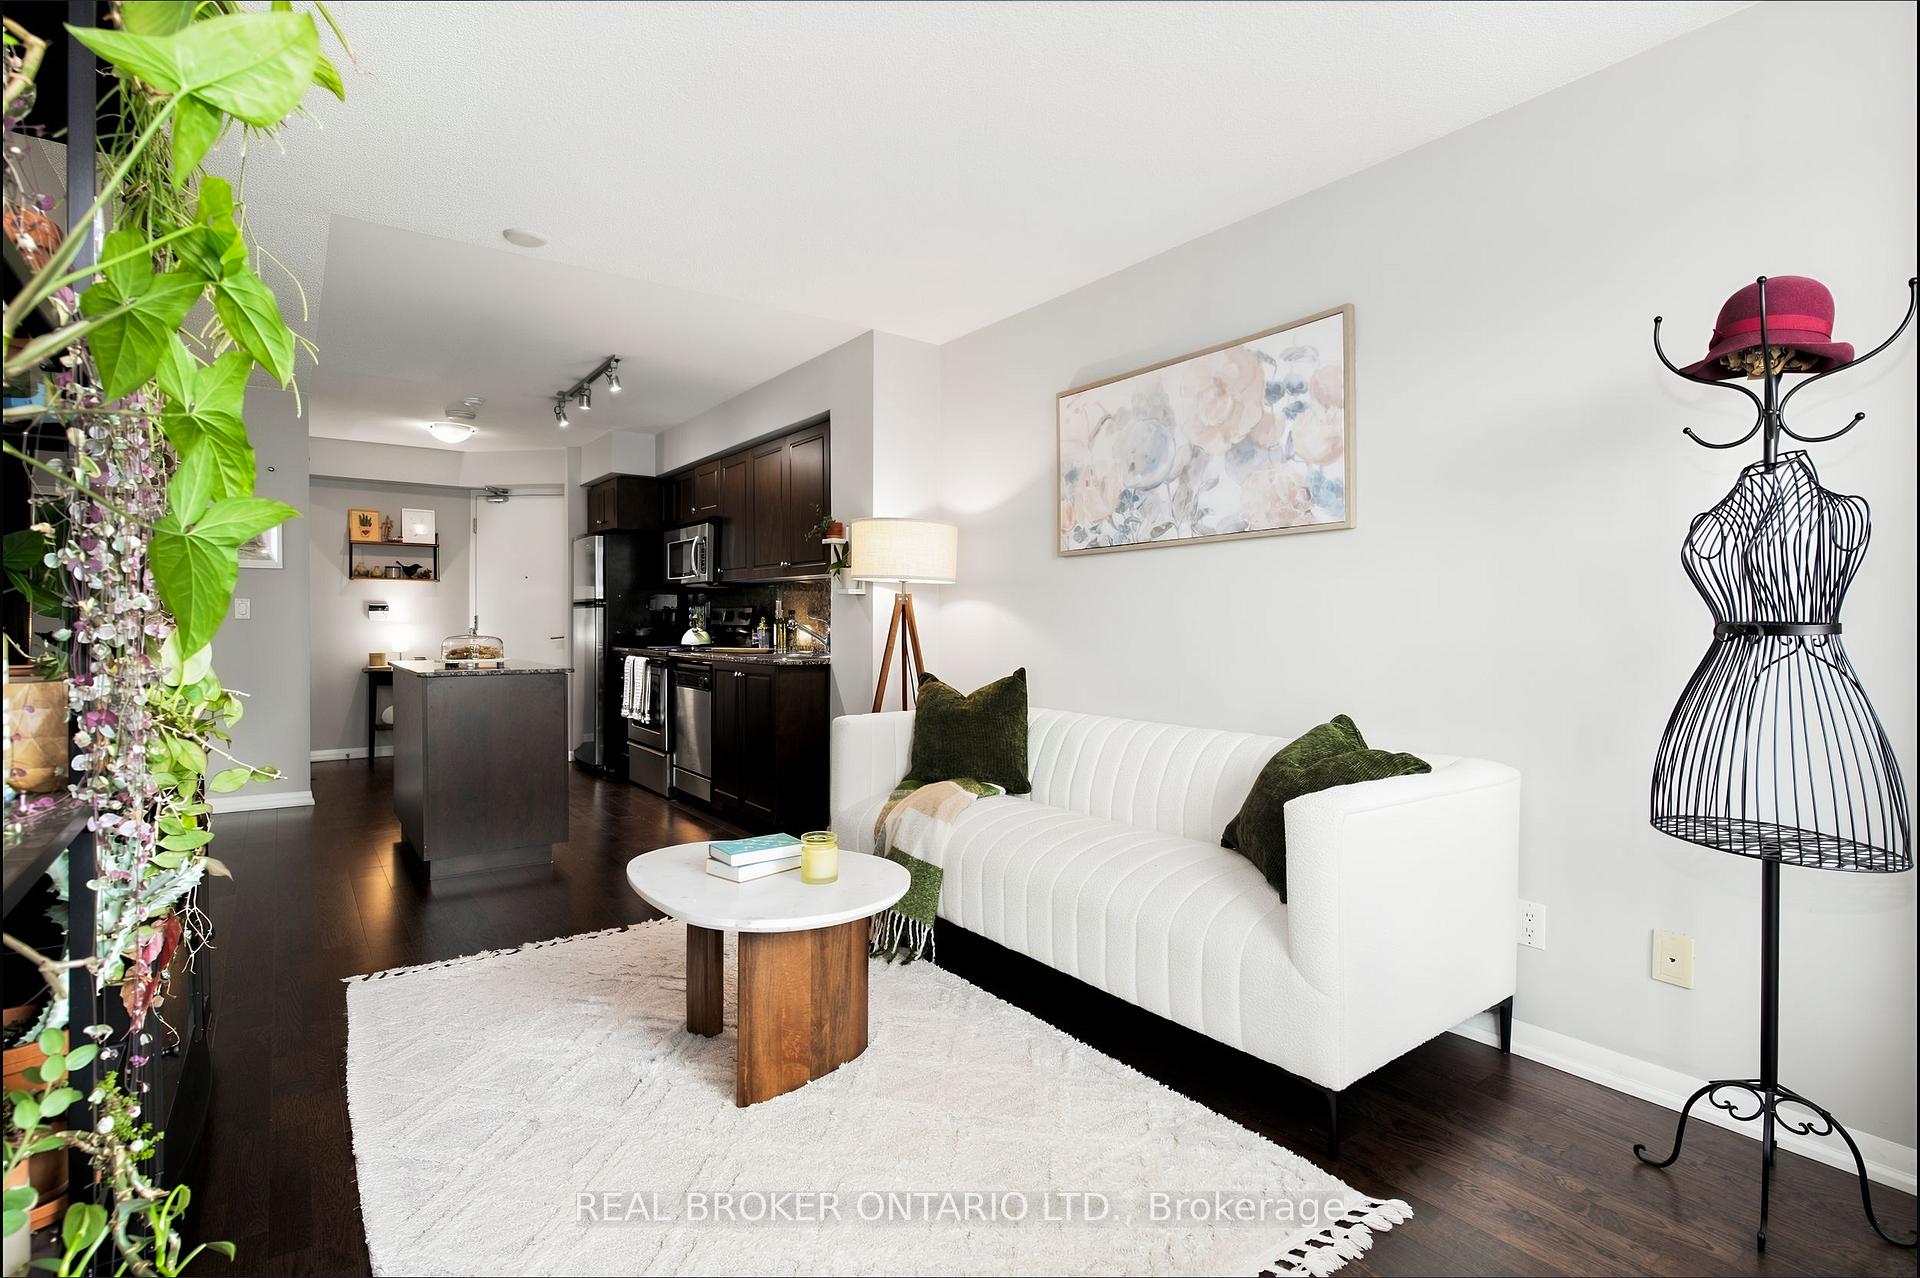
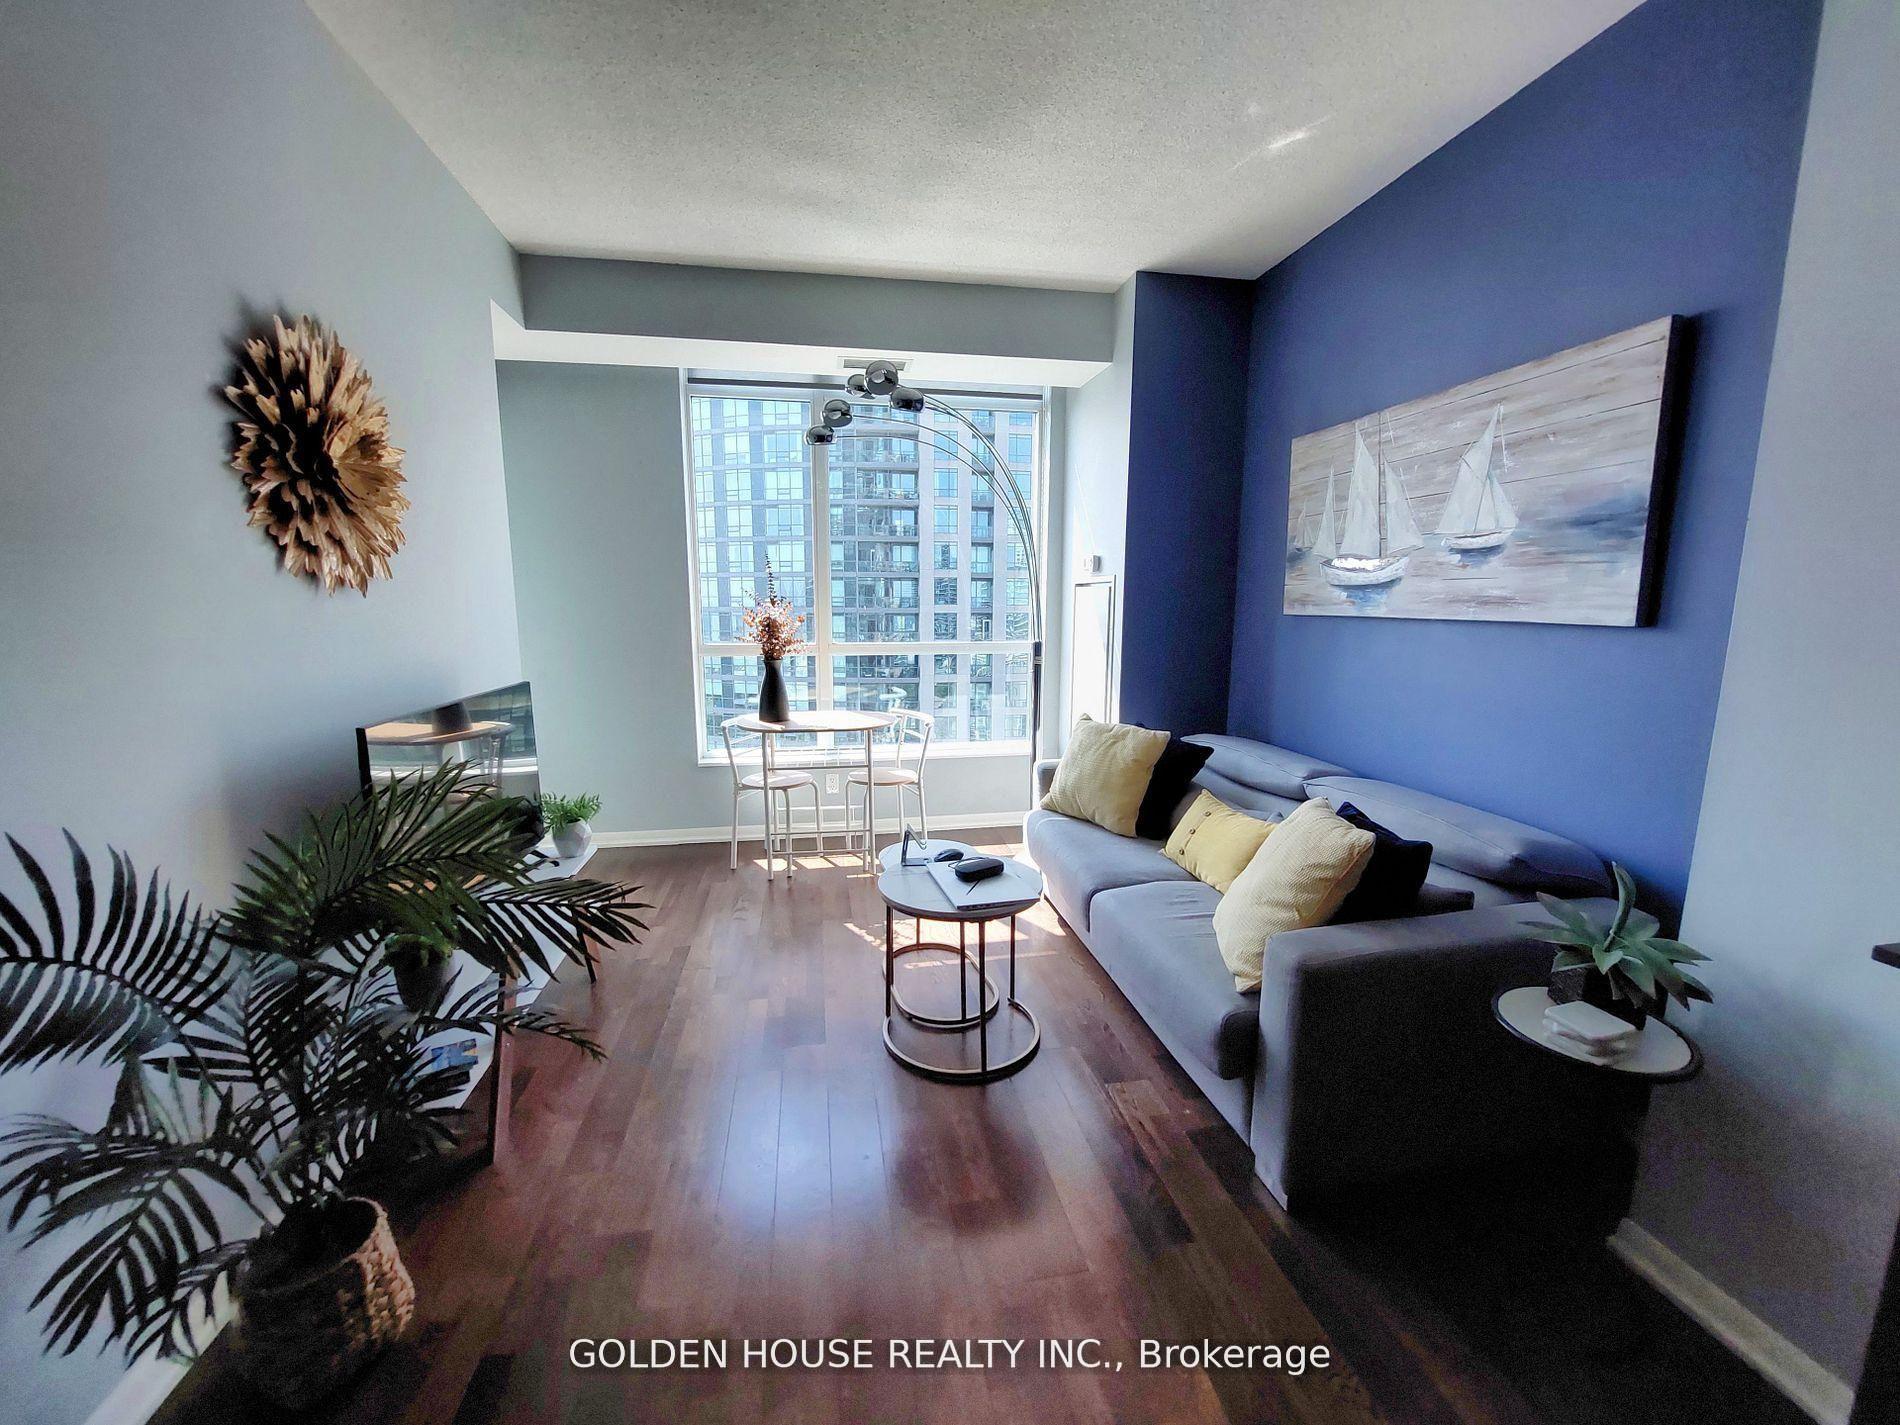
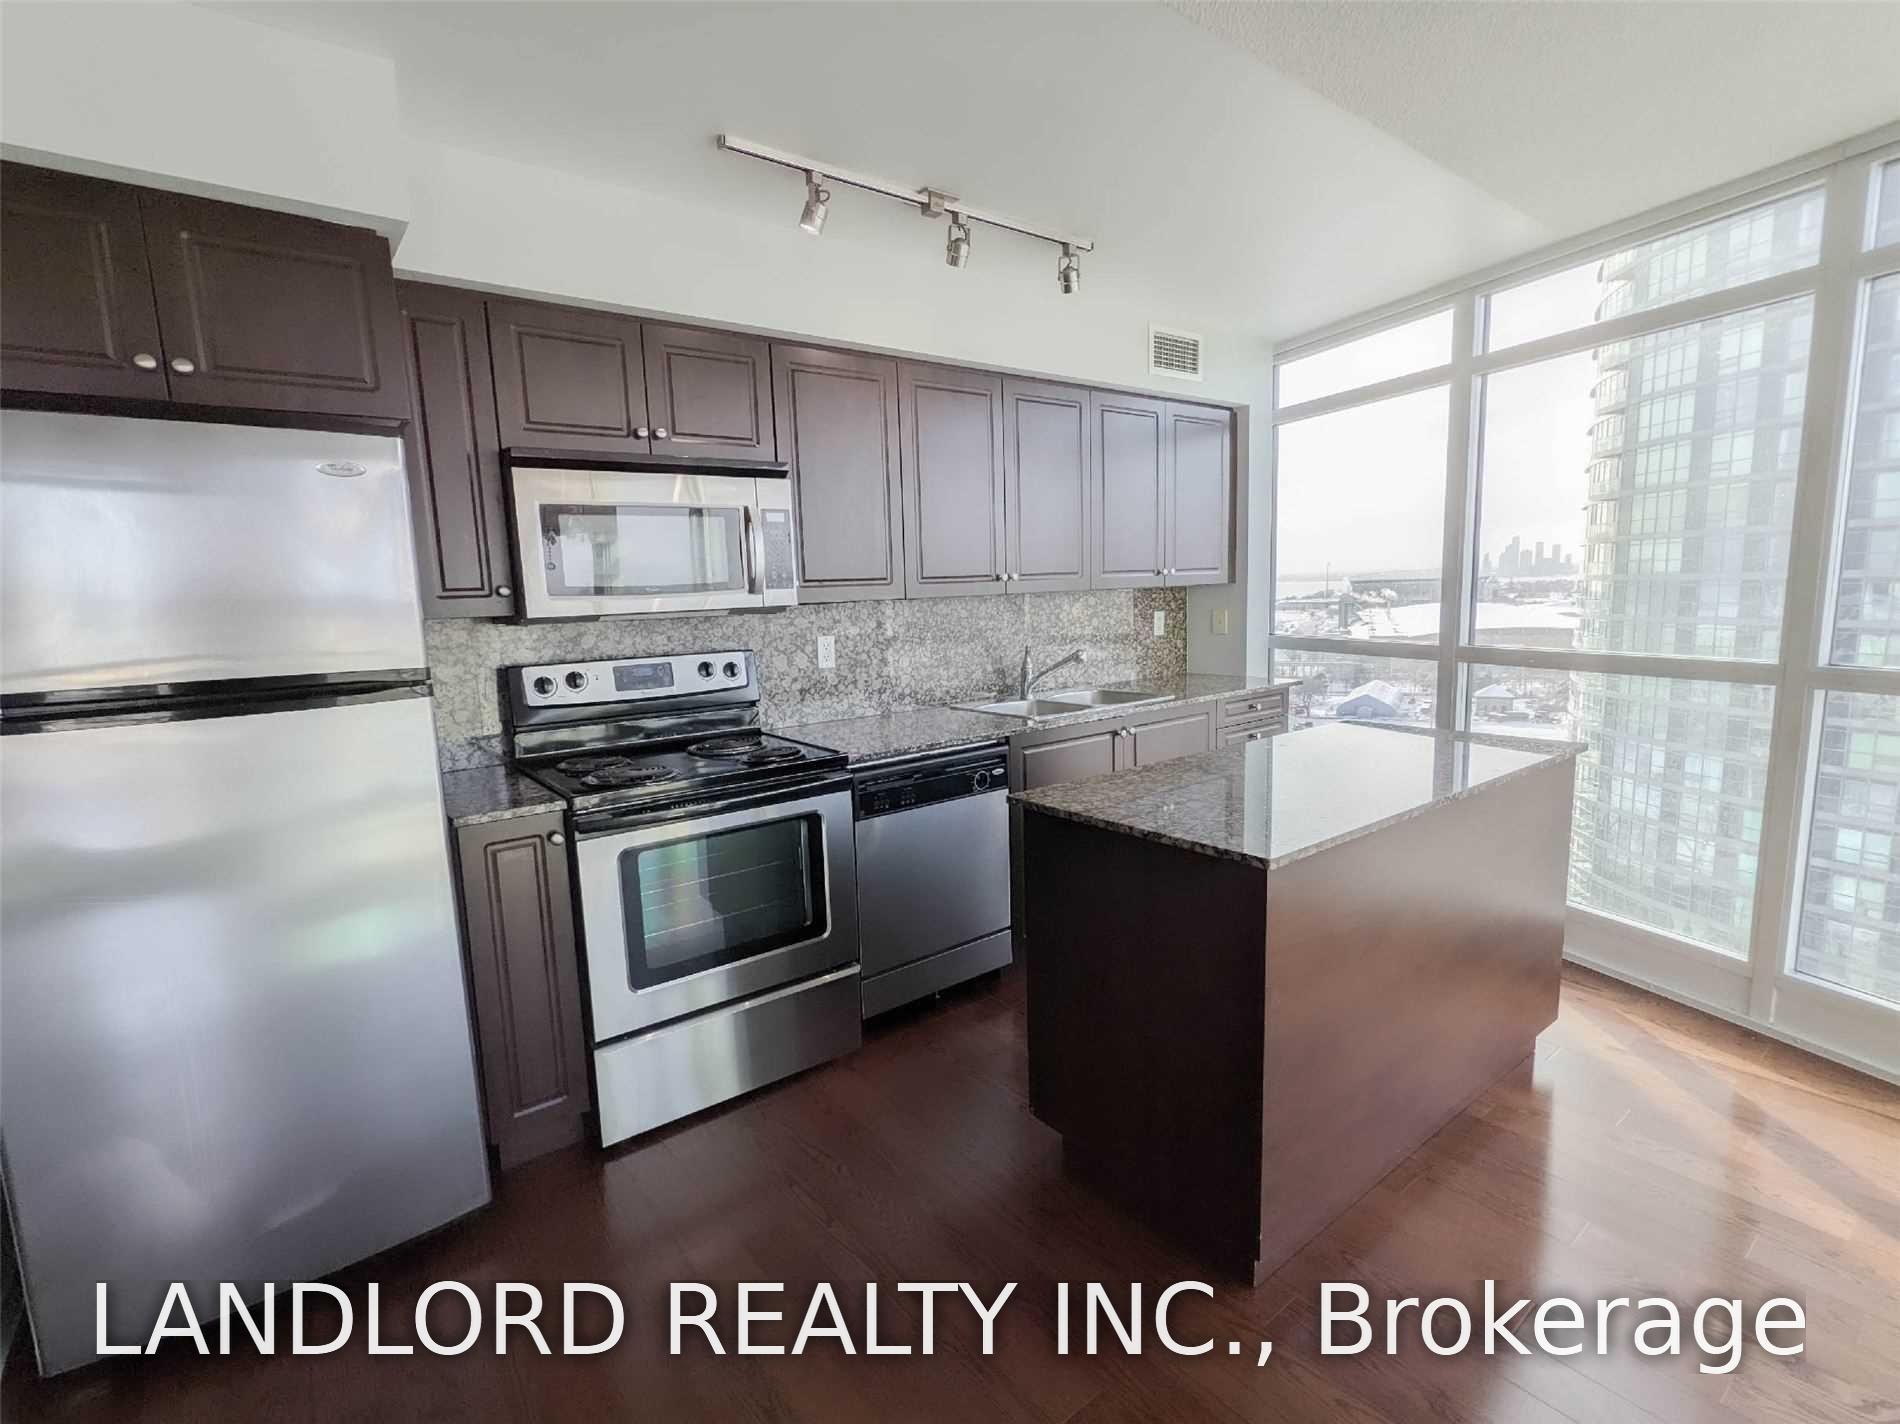
Unit 1206, 215 Fort York Boulevard
Toronto (Niagara)
Listed Aug 20, 2026
Condo ApartmentFor Sale
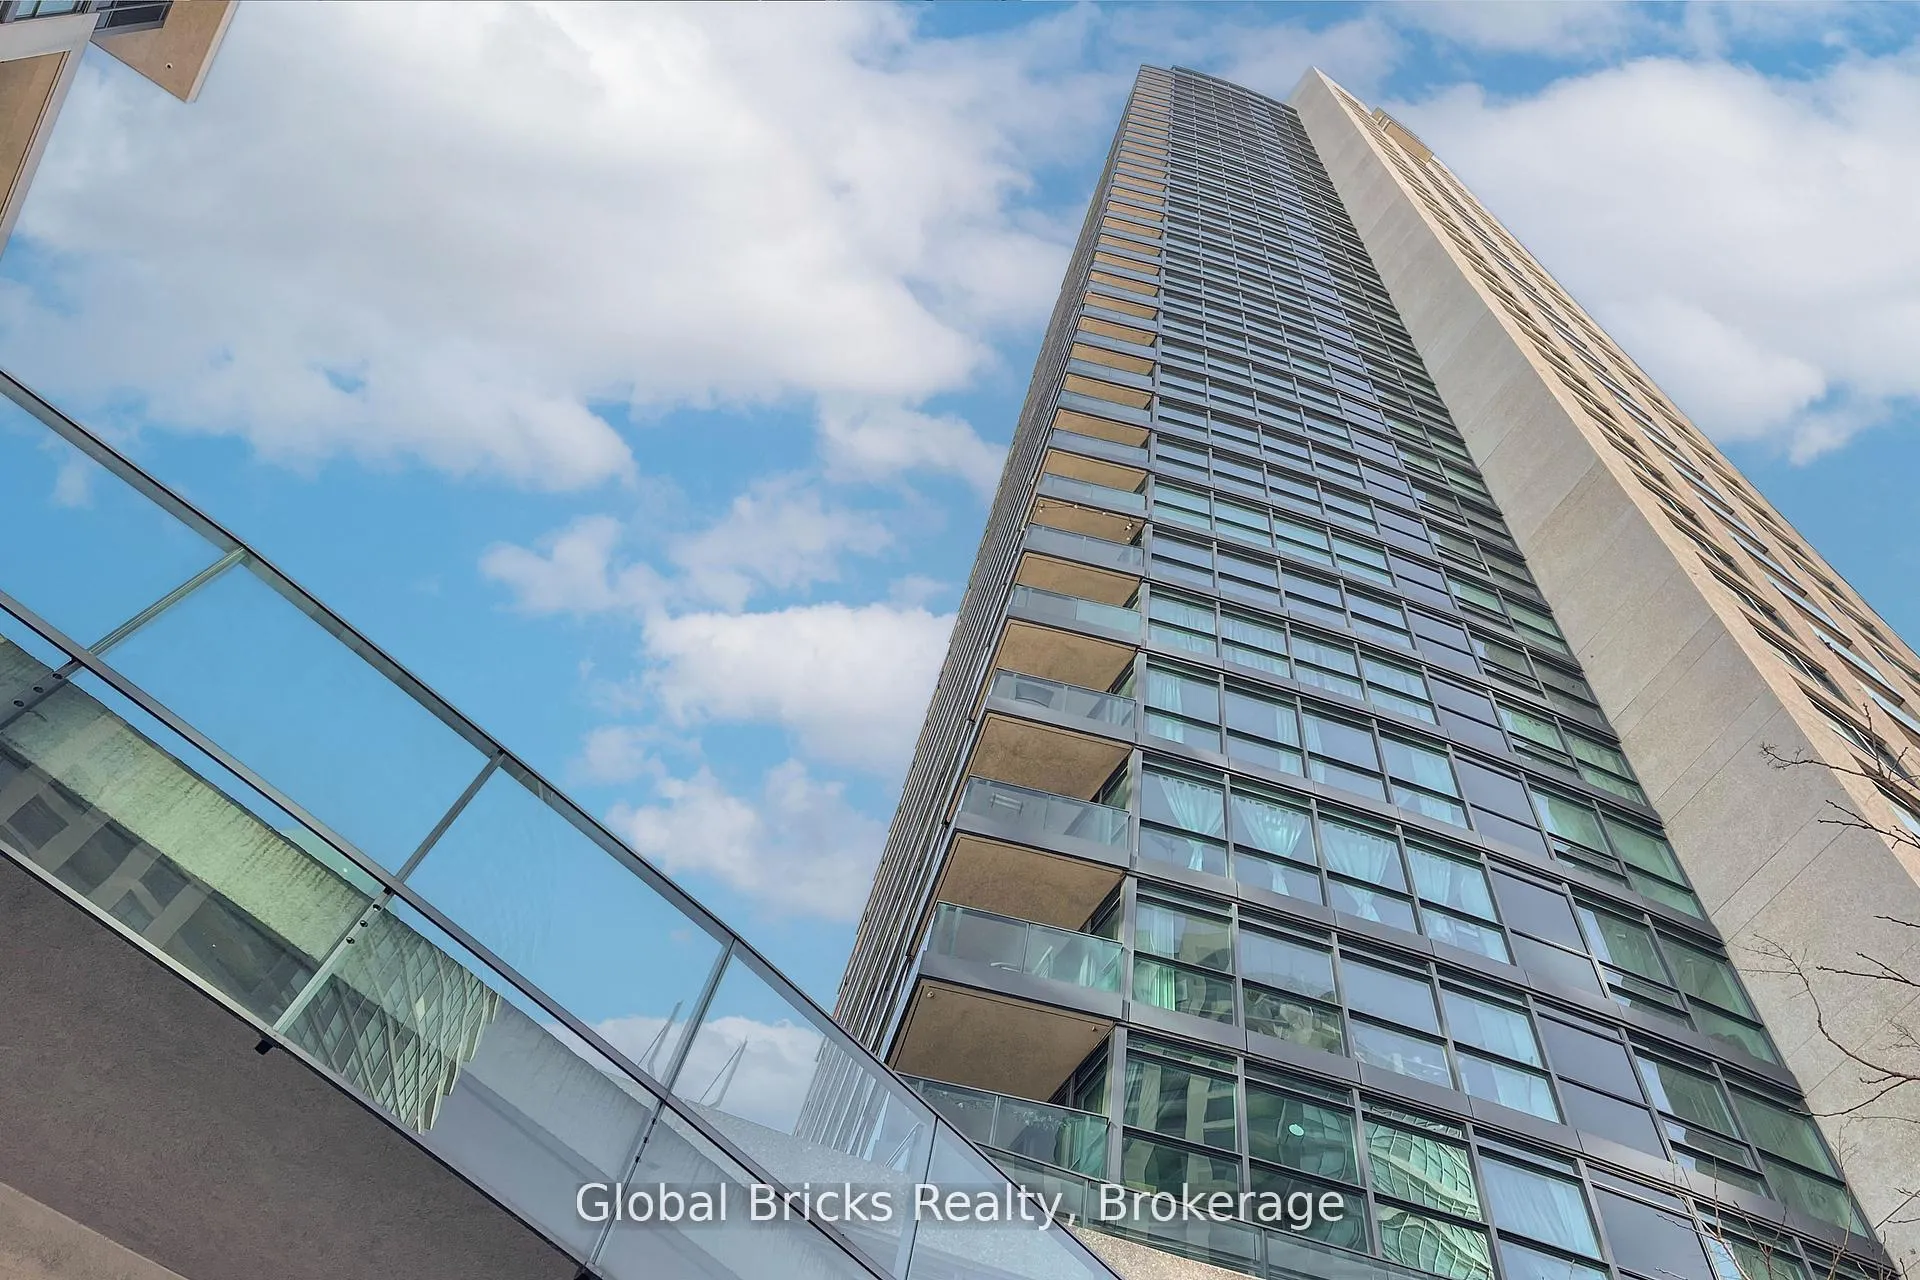
Unit #215, 215 Fort York Boulevard
Toronto (Niagara)
Listed Mar 16, 2026
Condo ApartmentFor Sale
7
Units for rent
From $1,900monthly
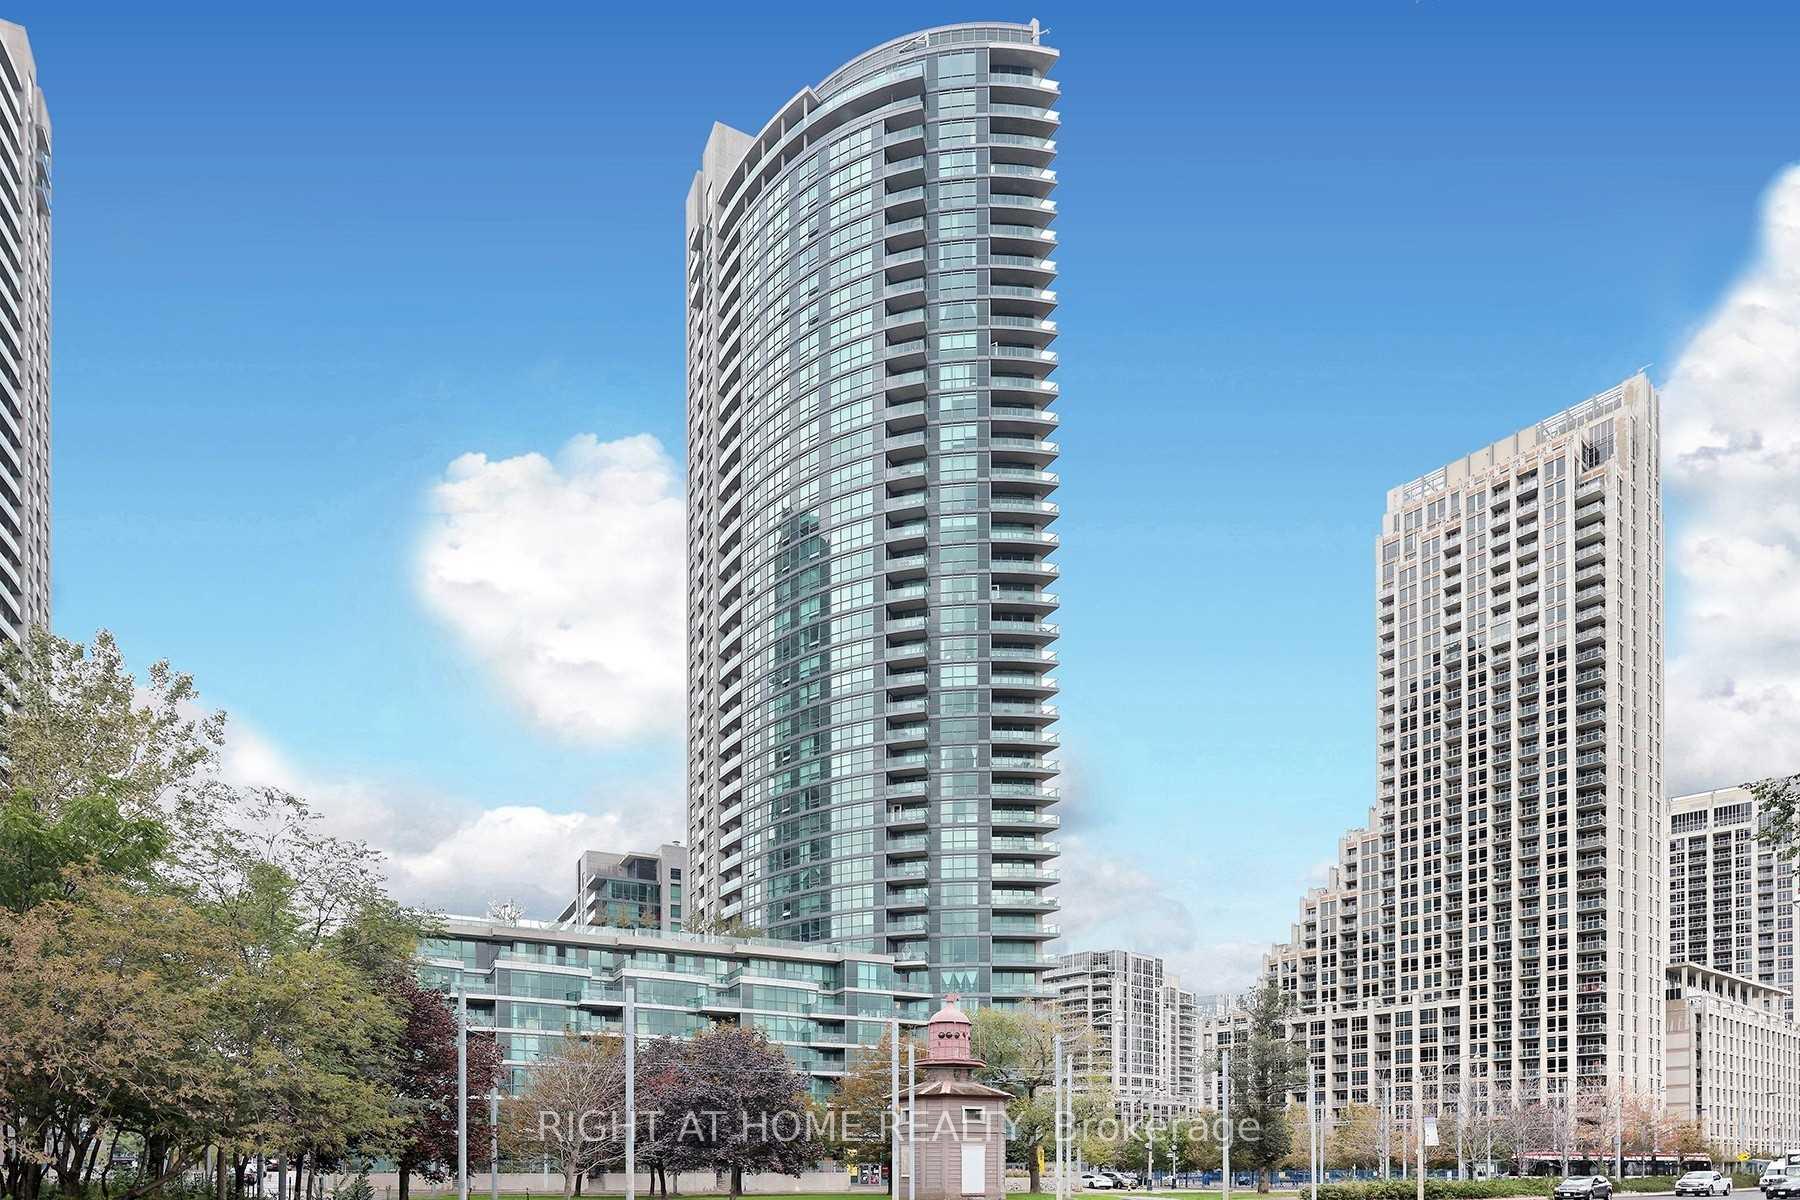
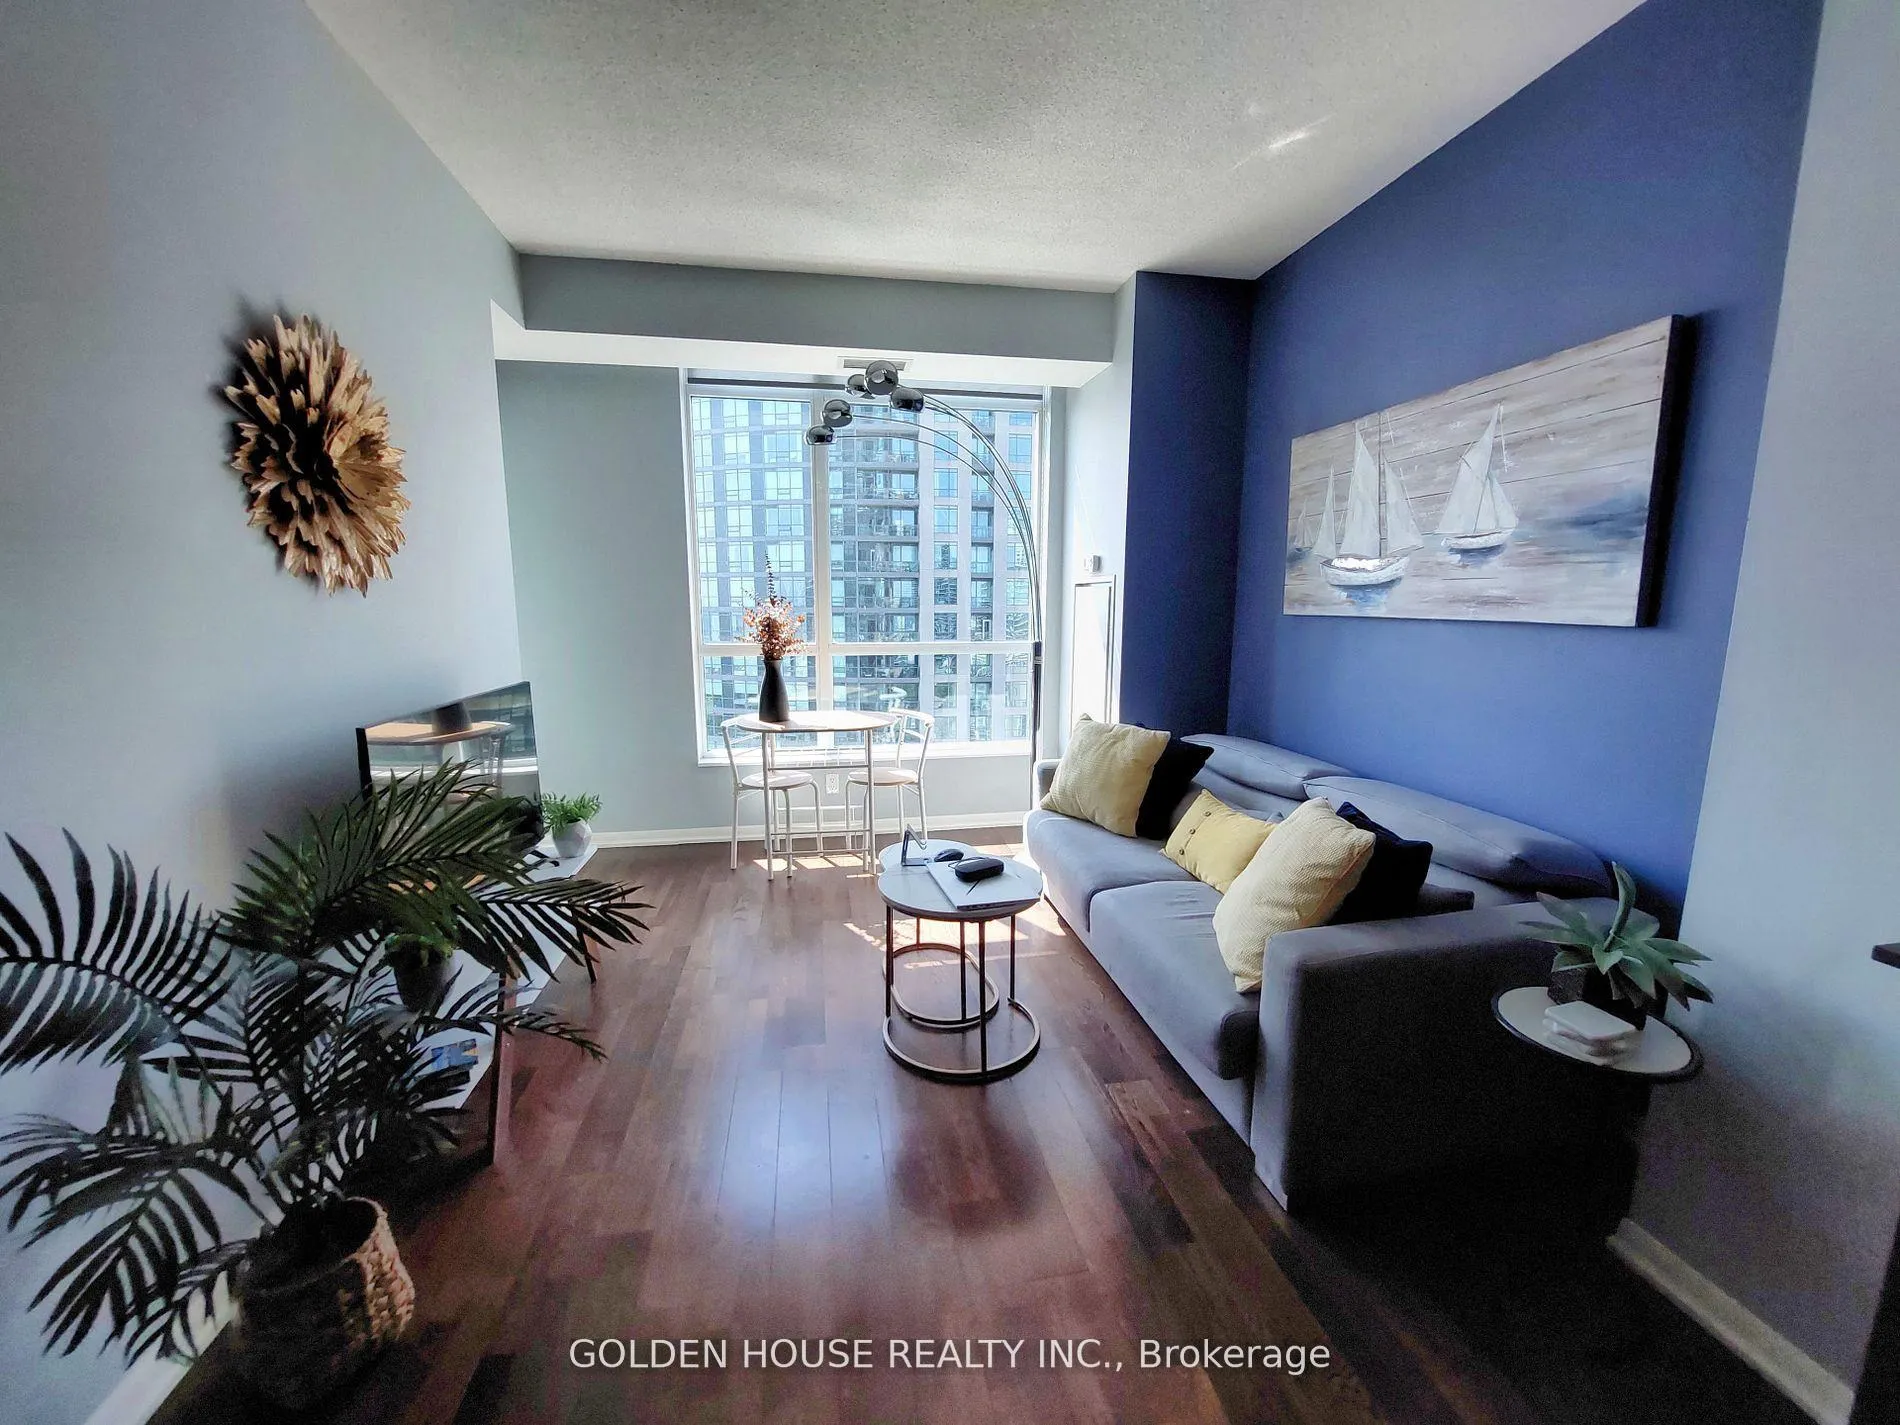
Unit 2306, 215 Fort York Boulevard
Toronto (Waterfront Communities)
Listed 15 days ago
Condo ApartmentFor Rent
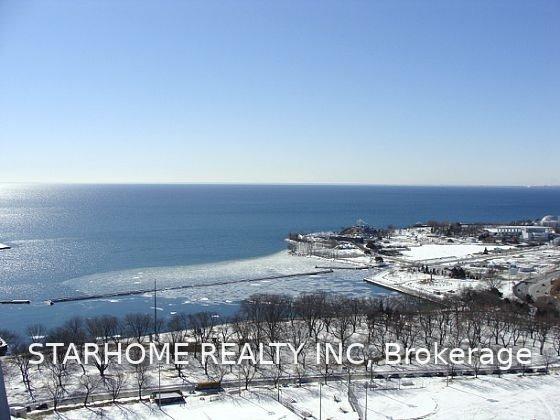
Unit 3307, 215 Fort York Boulevard
Toronto (Niagara)
Listed 7 days ago
Condo ApartmentFor Rent
Live MLS · Updated daily
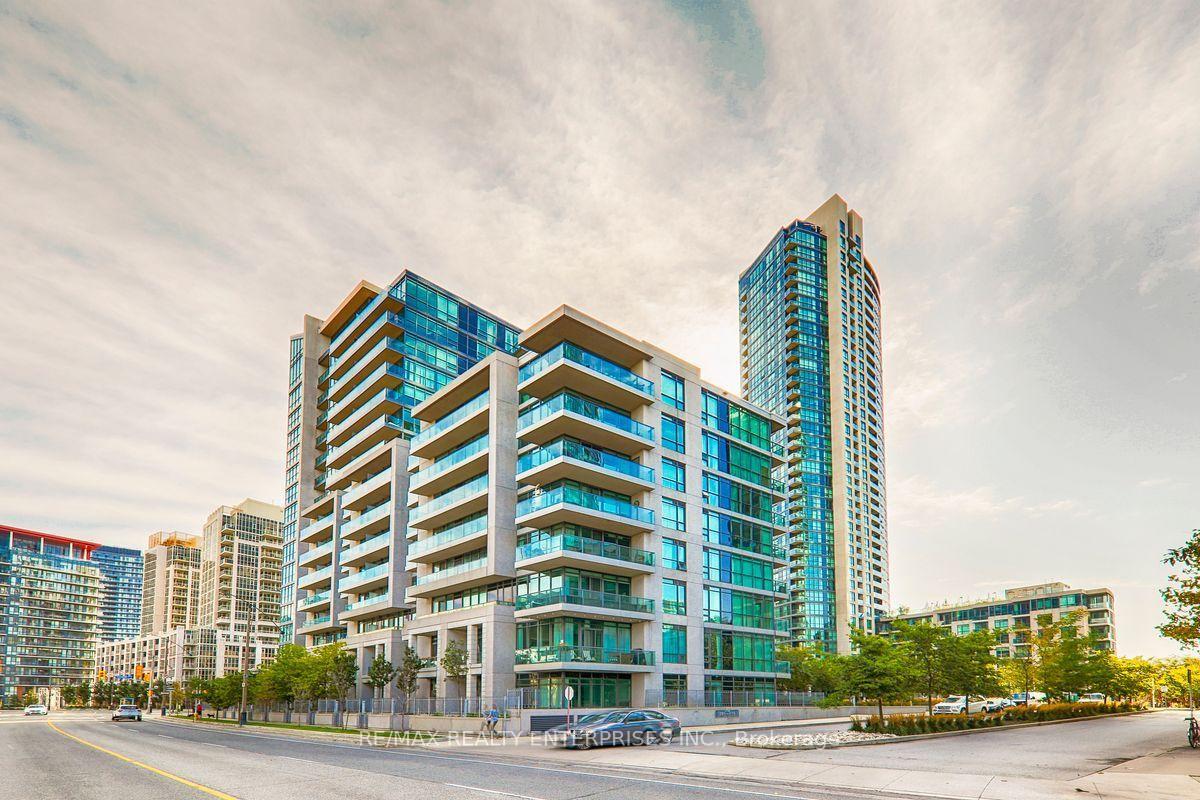
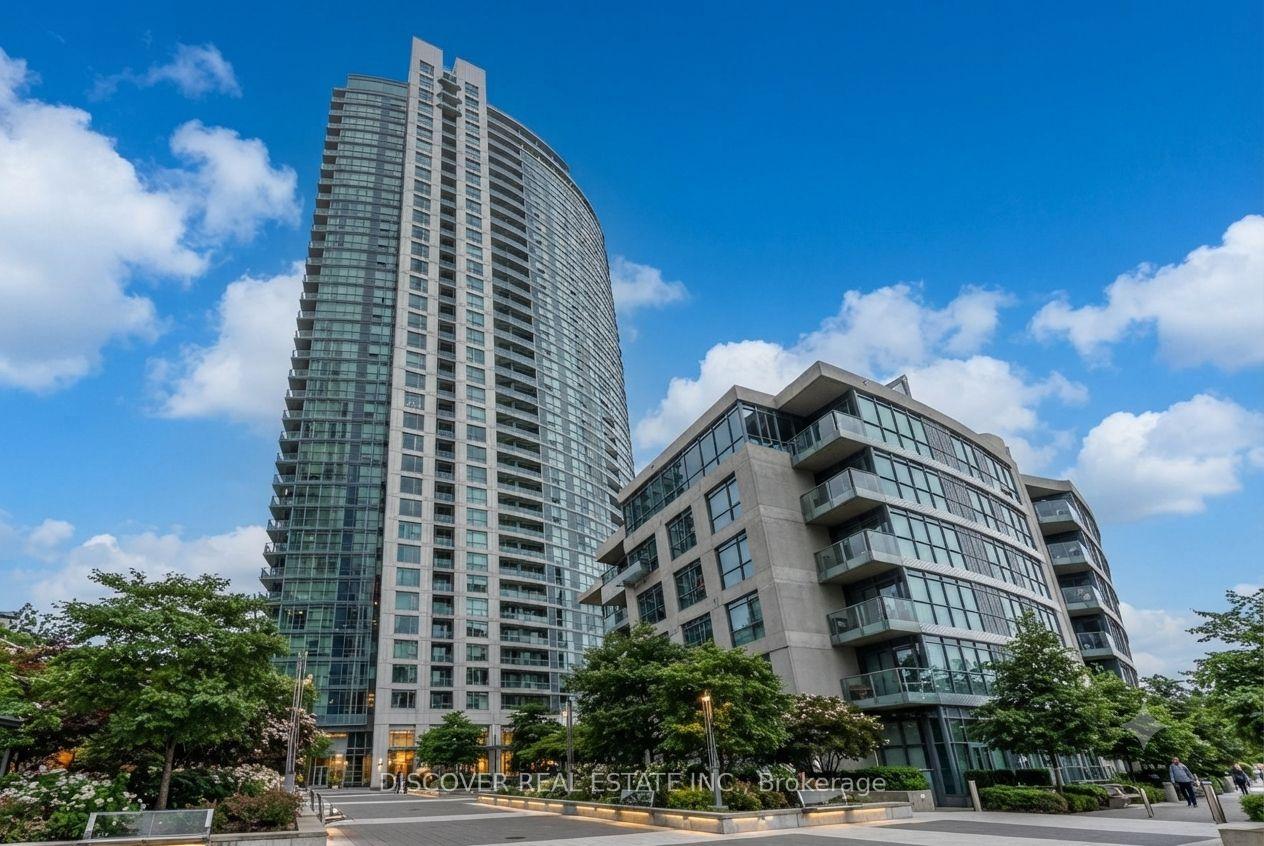
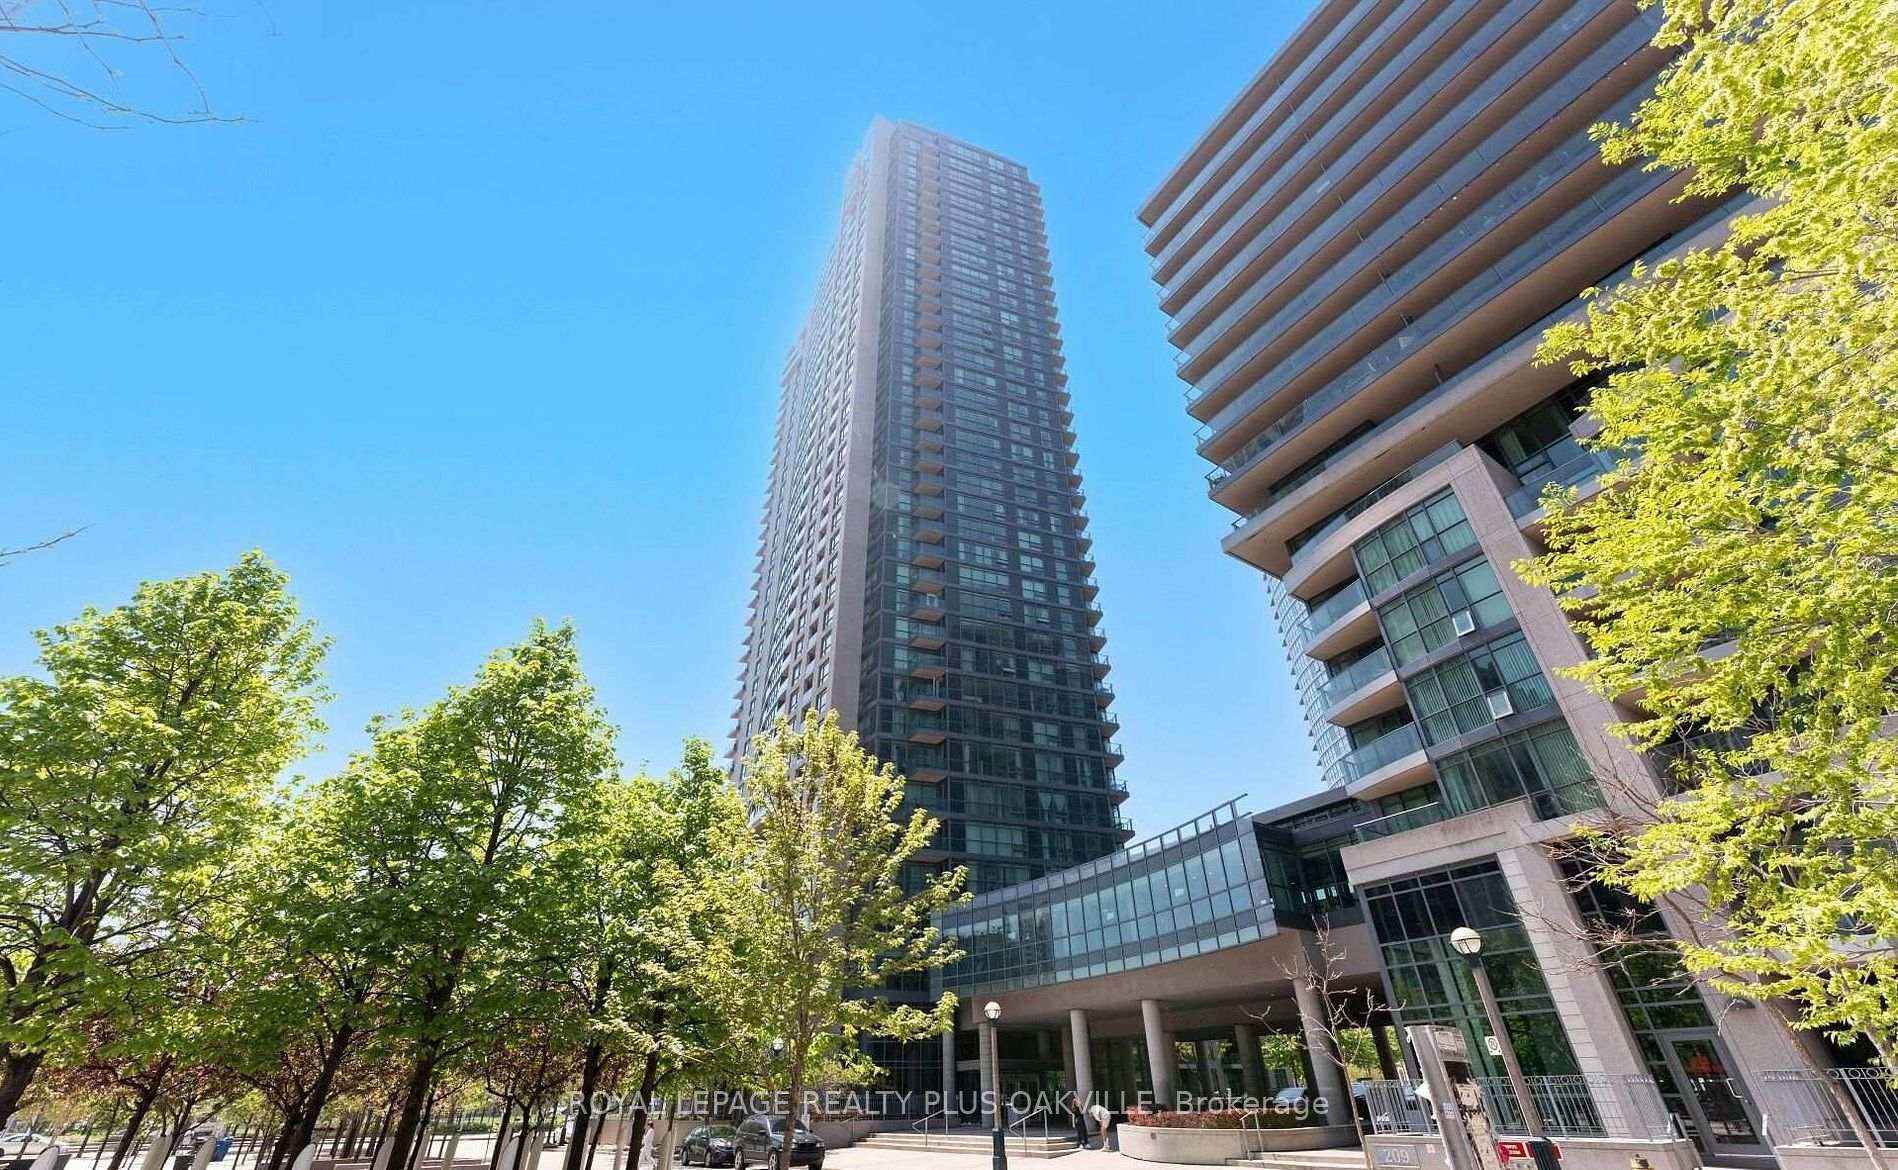
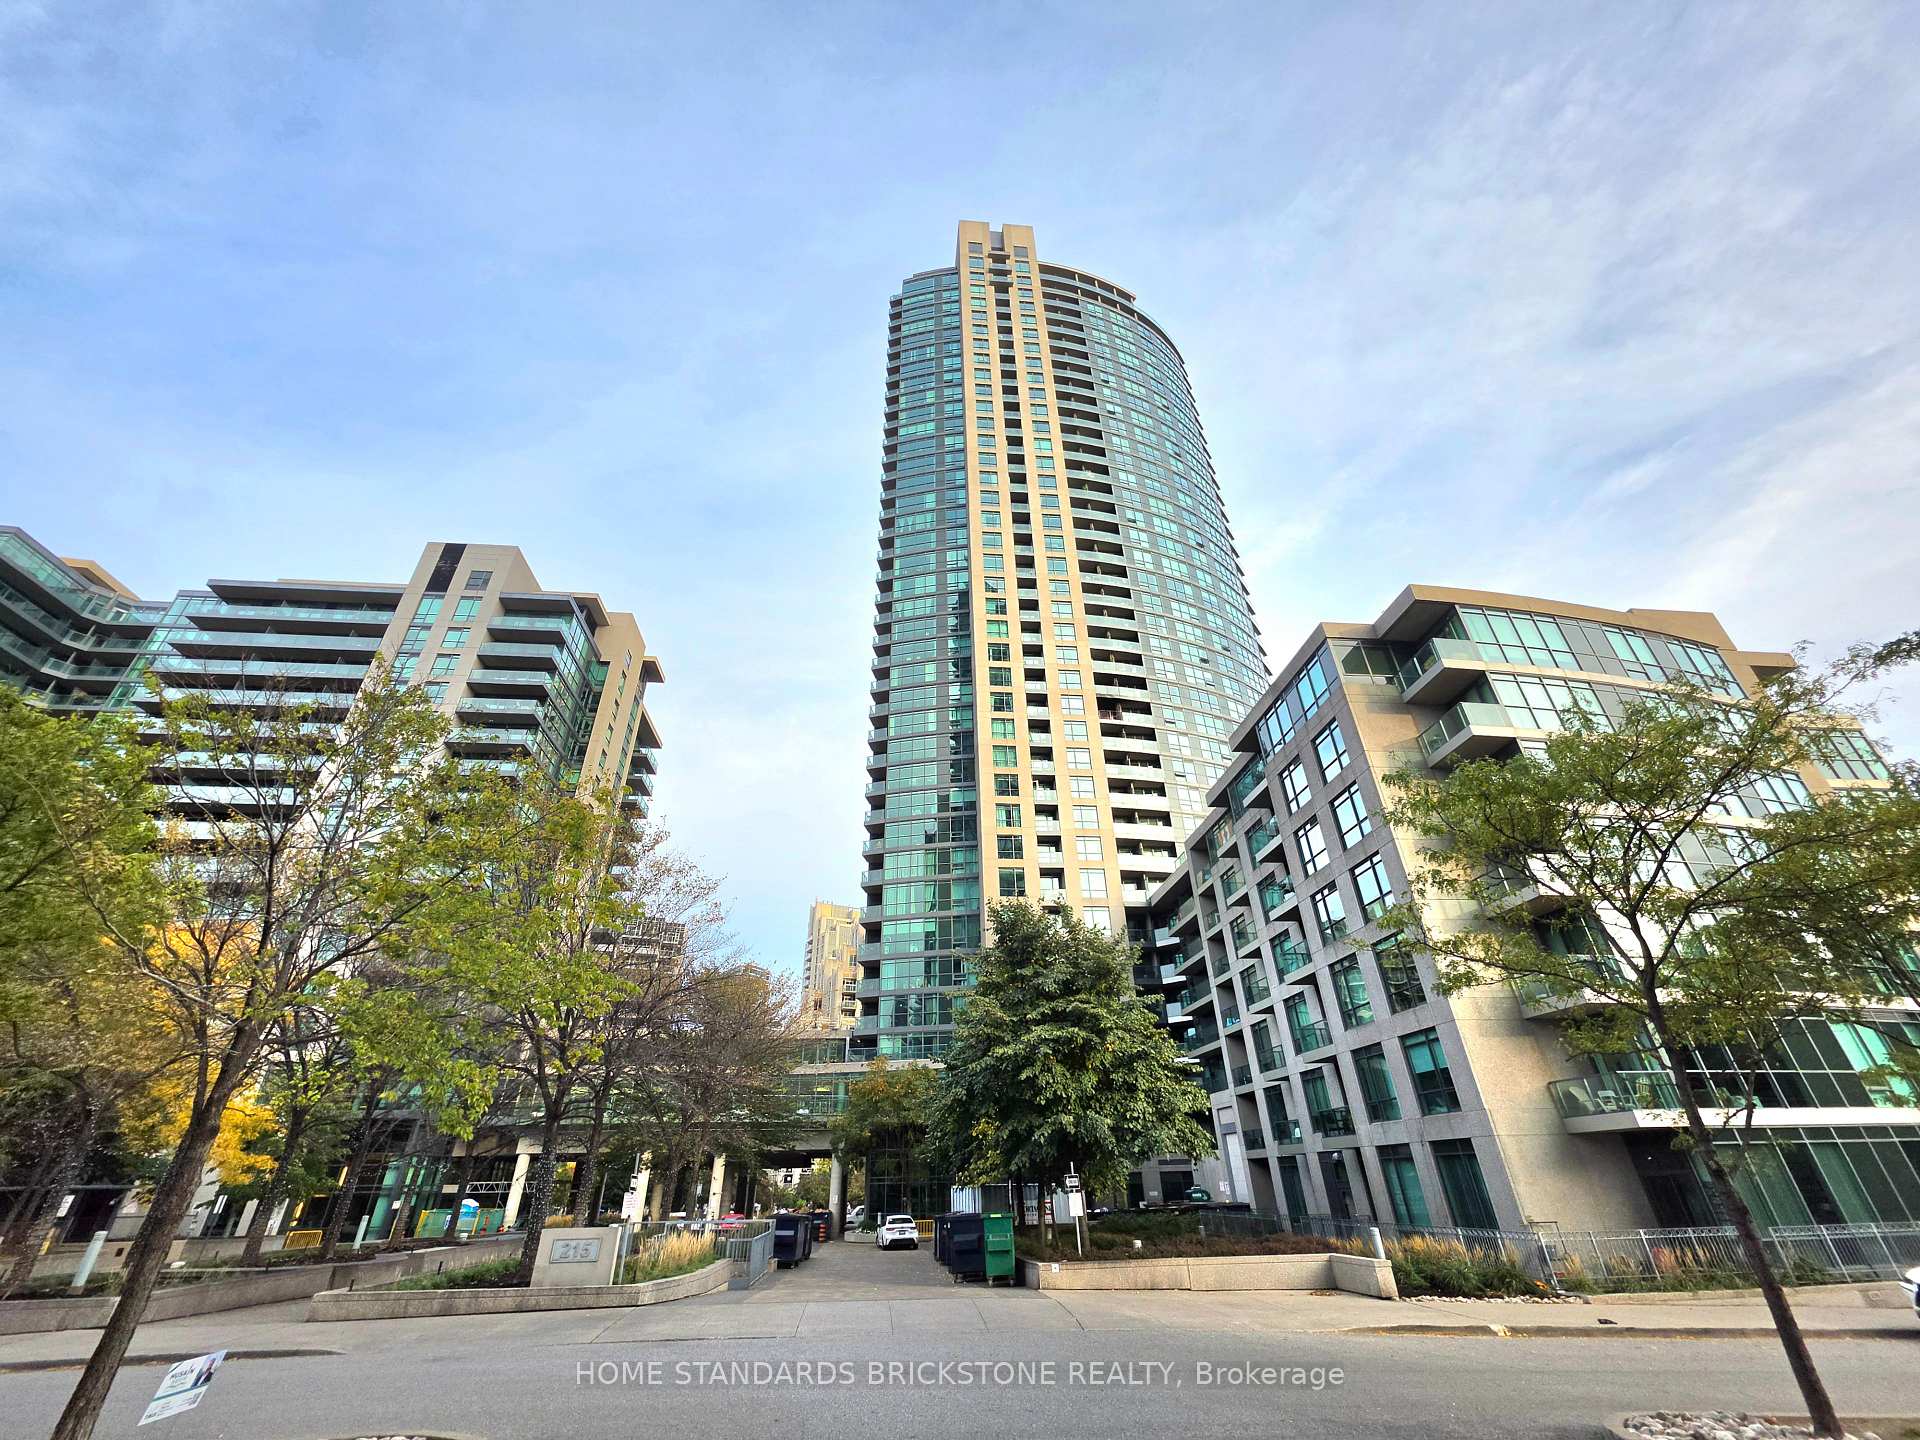
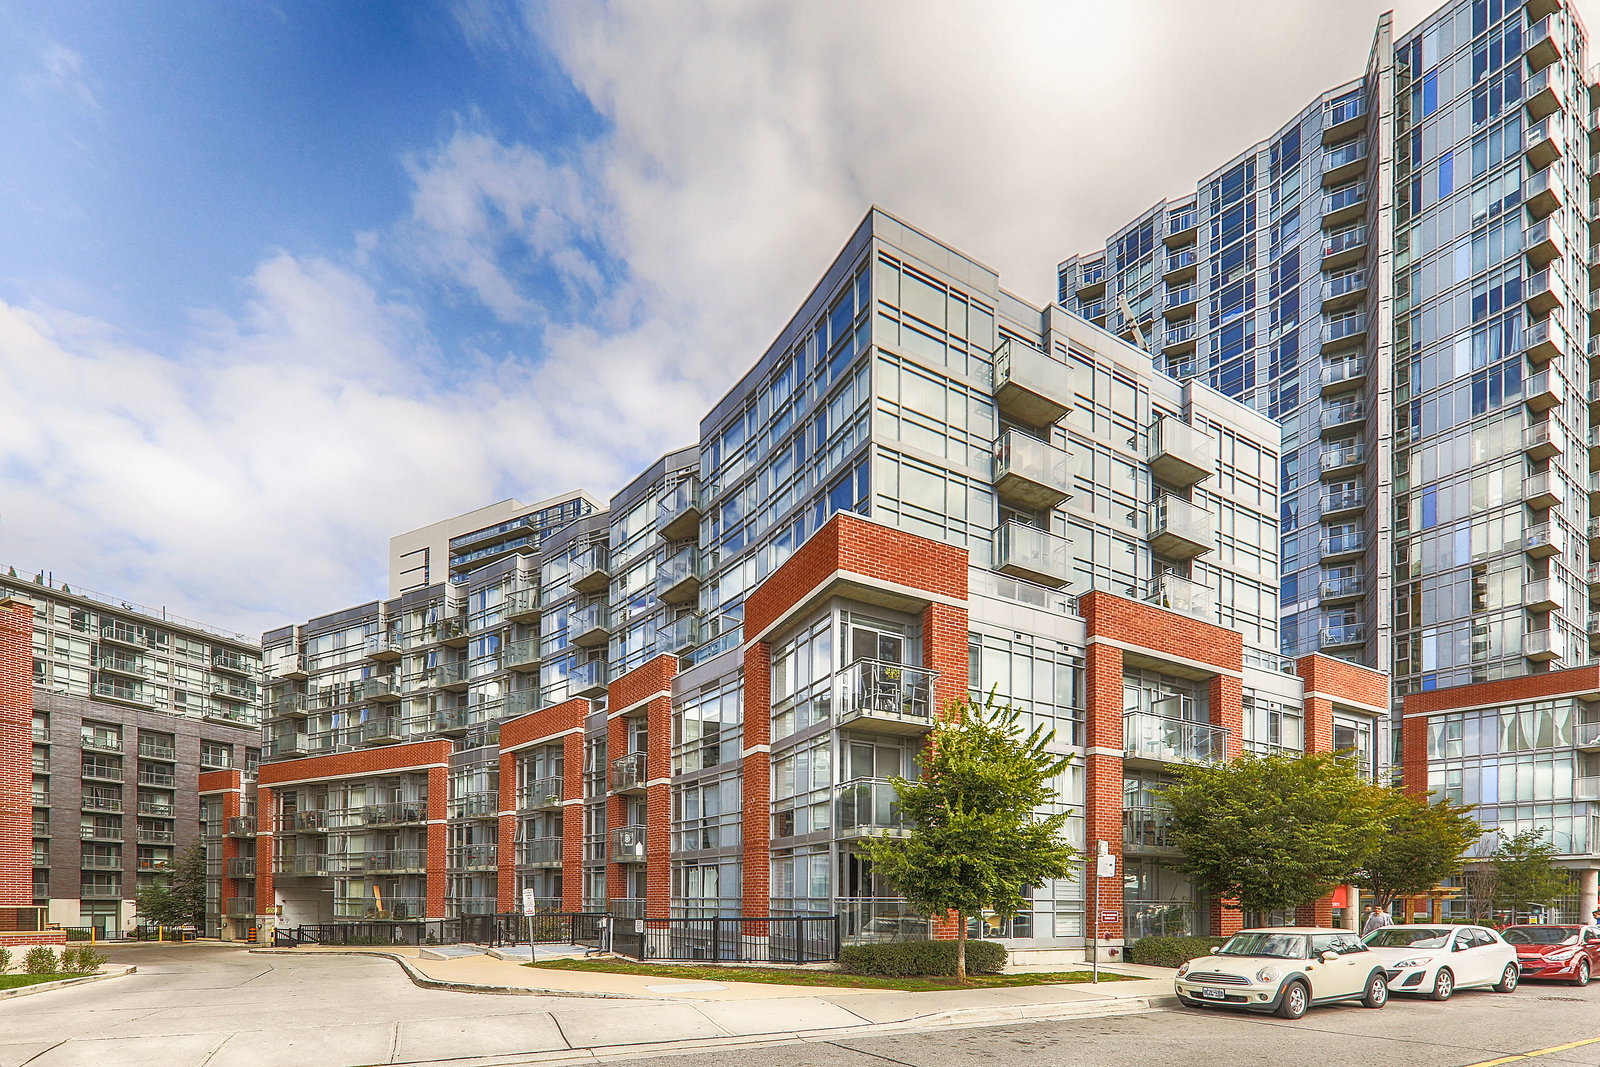
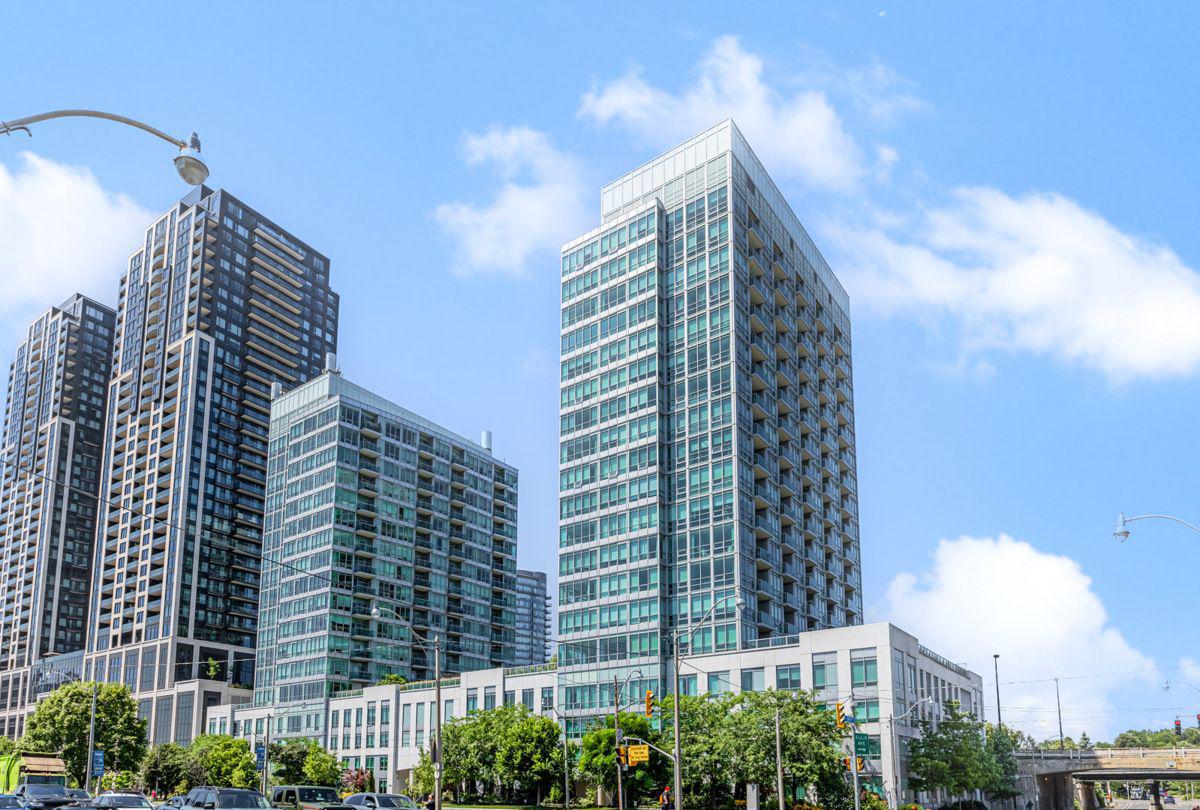
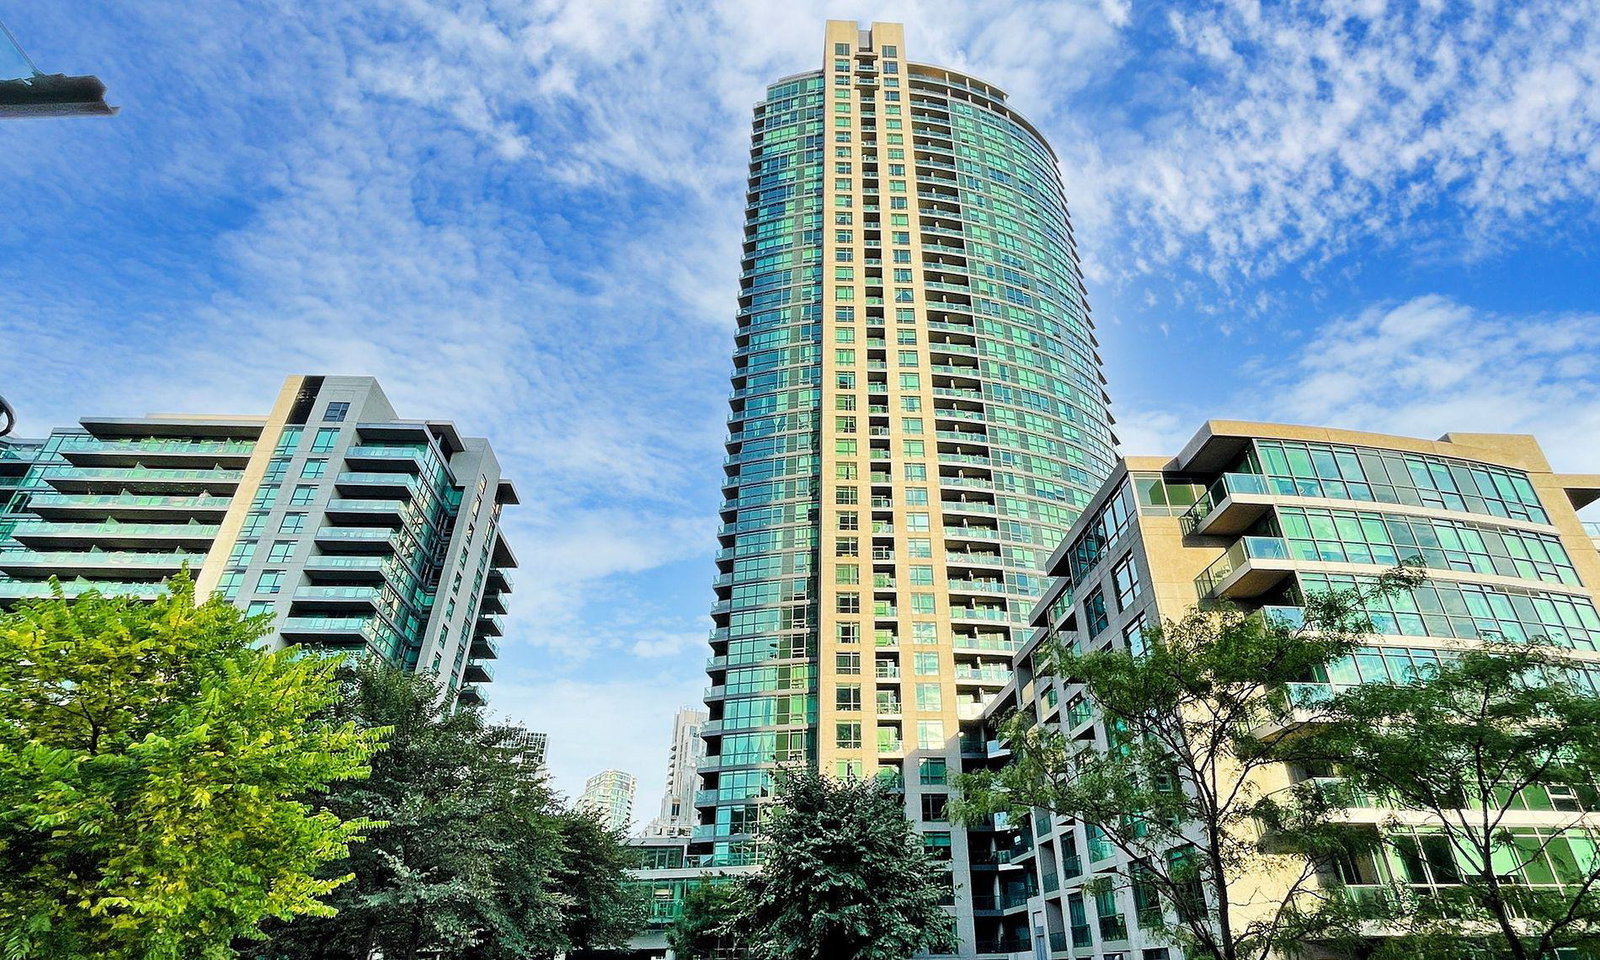
If a daily dose of nature is what you crave, but you just can't leave downtown Toronto, we've got the compromise you've been seeking. Situated at 215 Fort York Blvd and 209 Fort York Blvd, Neptune and Neptune 2 Condos is a 2-building complex with a modern glass exterior, home to 861 units.
For nature lovers and recreation enthusiasts, this location is a haven — from your front door you're just minutes from Garrison Common, where you can enjoy a scenic stroll and take in some history in the process. To the south you'll find the Martin Goodman Trail which extends for kilometers to the east and west, connecting to lakeside parks along the way.
Those who are athletically inclined — or are uncoordinated but try really hard — have plenty to keep them busy nearby; there are tennis courts, baseball diamonds, bike trails, rowing clubs, yachting, and ample green grass to run around and burn off some energy. And if nature and recreation just isn't your thing, have no fear, there's a ton of fun waiting for you to the north.
And while the prospect of living in a building with over 800 suites might discourage some buyers, 215 Fort York Blvd feels more like 2 separate buildings joined by a podium. Not to mention, that larger buildings often come with more extras.
In addition to a great location that balances natural scenery with urban convenience, residents are provided with a wealth of desirable amenities; pool, sauna, gym, party room, meeting room, rooftop patio, concierge, parking garage, security guard, and more.
Developer
Lanterra Developments
Year Built
2011
Property Type
High-Rise Condo
Storeys
38
Total Units
861
Management
Crossbridge Condominium Services Ltd.
Underground Parking
Indoor Pool
Guest Suites
Fitness Centre
Rooftop Garden
Visitor Parking
Party Room
24/7 Concierge
$802
Avg $/sqft
-12.2%
YoY change
30
Avg days on market
Walk Score
81/100
Daily errands on foot
Transit Score
96/100
TTC, GO, subway access
Bike Score
74/100
Bike lanes & infrastructure
Neighbourhood in Toronto
Fort York is a vibrant neighbourhood in Toronto. It offers a mix of parks, schools, and plenty of dining options.
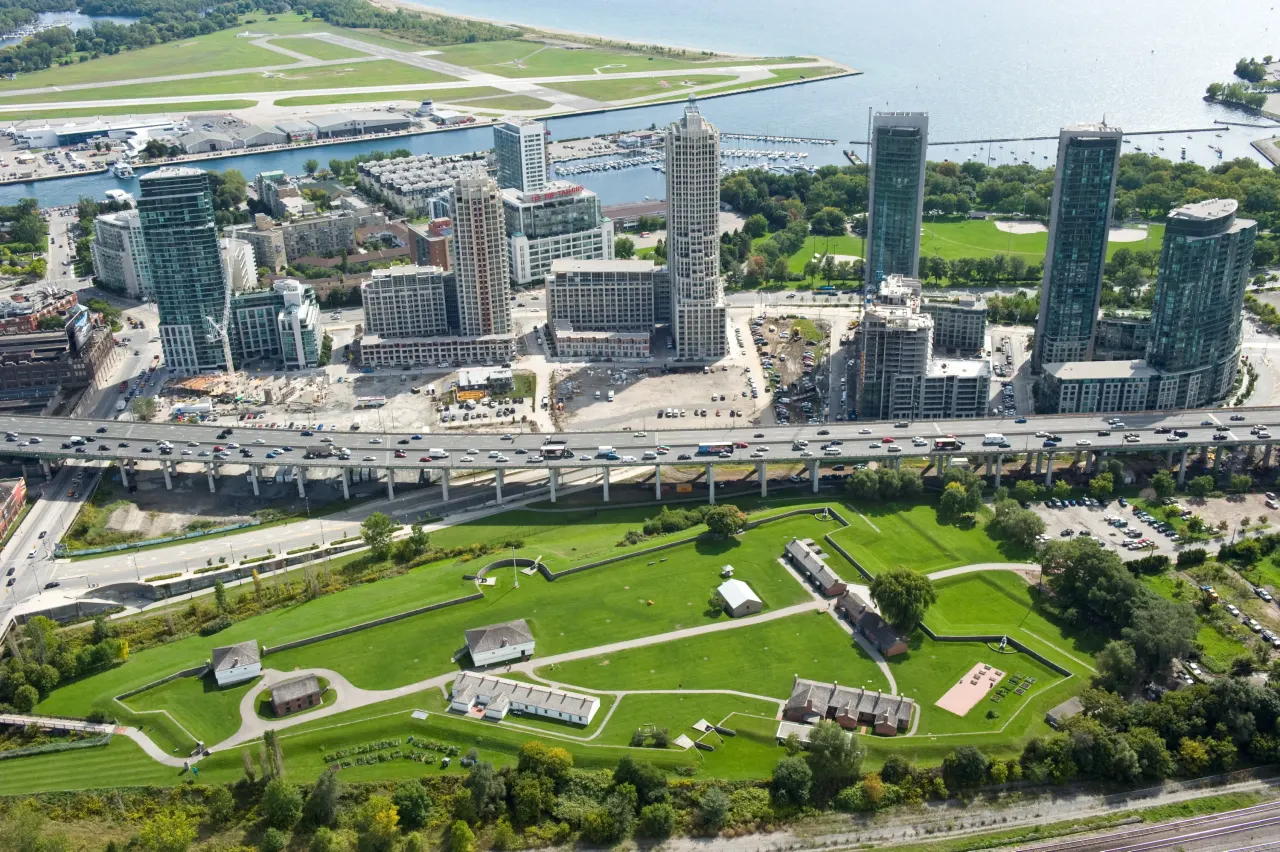
Toronto, Ontario
© Wikimedia Commons contributors (CC BY-SA)
Median asking price
In Ontario
$716,900
Median monthly rent
In Ontario
$2,499
For sale
0
For rent
0
Recently sold
Sign in to see sold data
Recently leased
Sign in to see leased data
Market data as of 2026-08-16. Sold and leased figures are neighbourhood medians over the last 12 months, published only where at least 5 homes closed — never a single sale.
What people love
Keep in mind
Daily life in Fort York is active and community-focused, with many amenities within reach. Residents enjoy a blend of urban living and green spaces.
The boundary
2.3 km²
Every count and every census figure on this page was measured inside this line — not within a circle drawn around a centre point.
19
Parks
8
Playgrounds
13
Transit stations
5
Grocery stores
15
Restaurants
15
Cafés
11
Gyms
3
Pharmacies
Counted across all 2.3 km² of Fort York. From OpenStreetMap, as of 2026-10-26.
20,071
Population (2021)
2.2 km²
Area
9,024
People per km²
32.9
Median age
$93,869
Median income
47%
Own their home
1.6
People per household
12,405
Households
Every age
What is built here
Own or rent
47%Owners
53%Renters
Across 12,405 households
When it was built
Mostly 2011–2015
Share of occupied homes, by the era they were built in. Bars are drawn against the busiest era, not against each other, because the eras are not the same length. The eight shares are unlikely to total exactly 100: Statistics Canada rounds each era's count to the nearest 5 before publishing it, so we print what the census reports rather than adjusting a figure to make the column add up.
Statistics Canada, Census of Population 2021. Added up from 6 census areas inside the boundary. Medians and rates are a population-weighted average of dissemination-area figures.
Sources: HOMEH listings, Statistics Canada, Census of Population 2021, OpenStreetMap, HOMEH school registry, Photo: © Wikimedia Commons contributors (CC BY-SA)