Year Built
2005
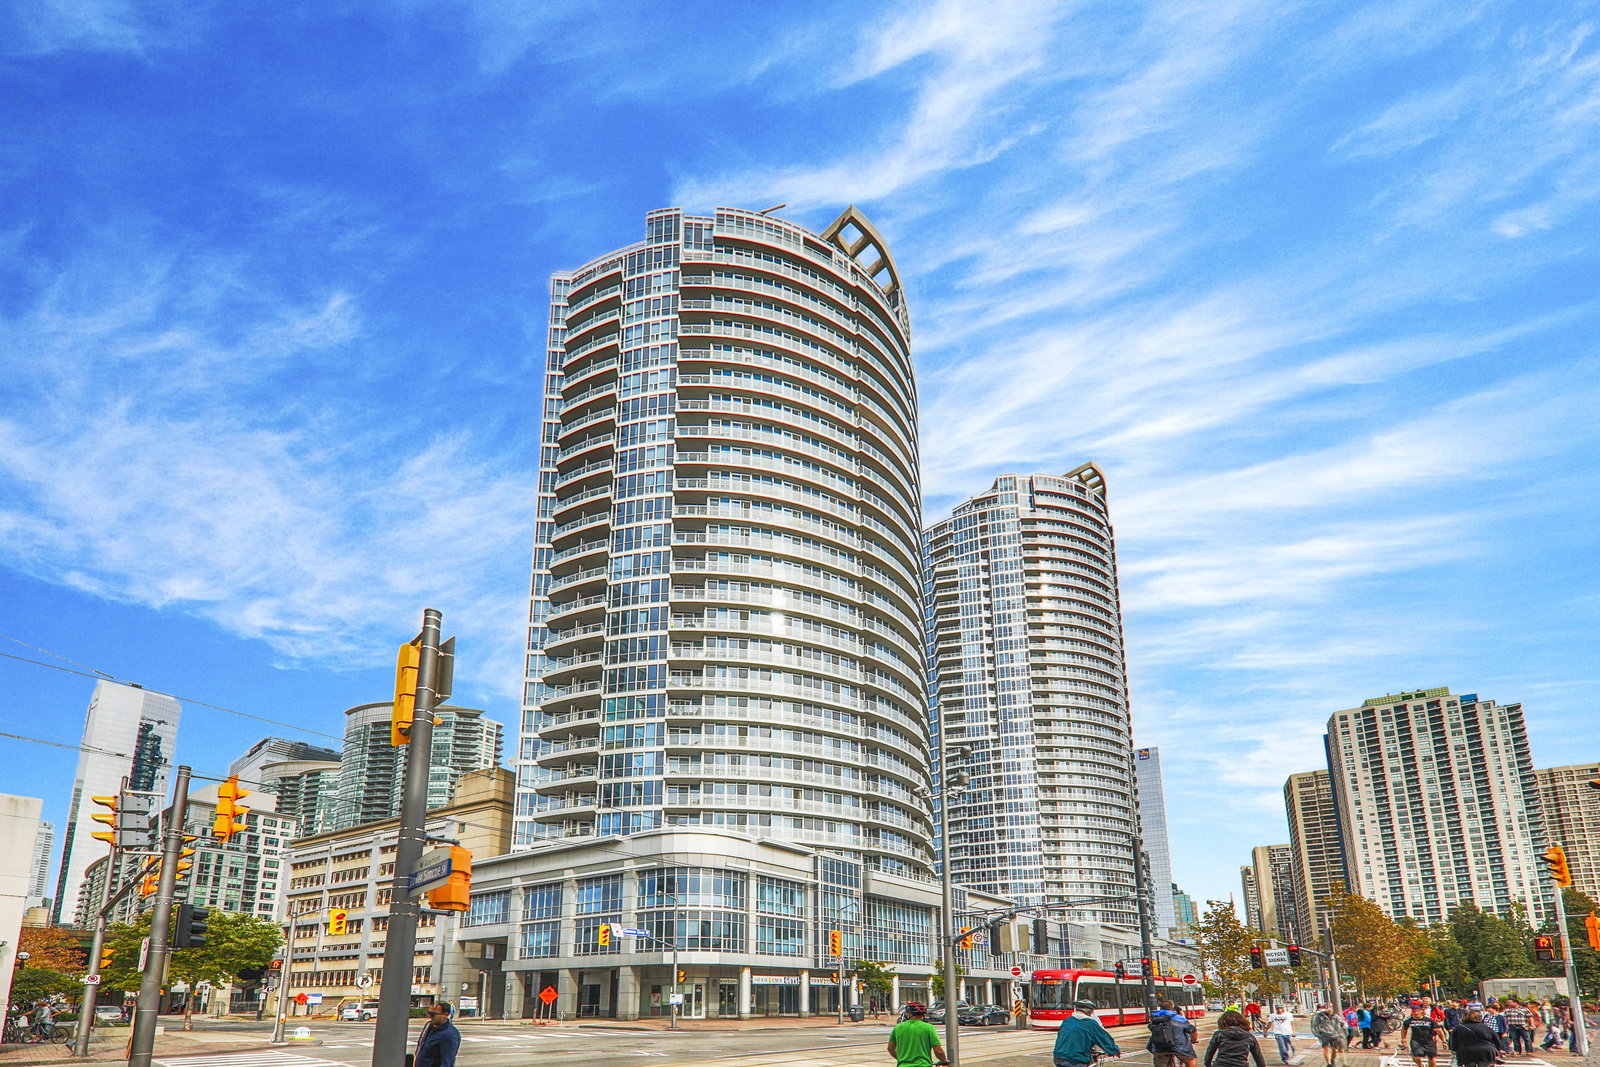
by Kolter Group
218 Queens Quay W, Toronto, ON M5J 2Y6
Year Built
2005
Total Units
296
Avg $/sqft
$837
Storeys
27
4
Units for sale
From $749,000
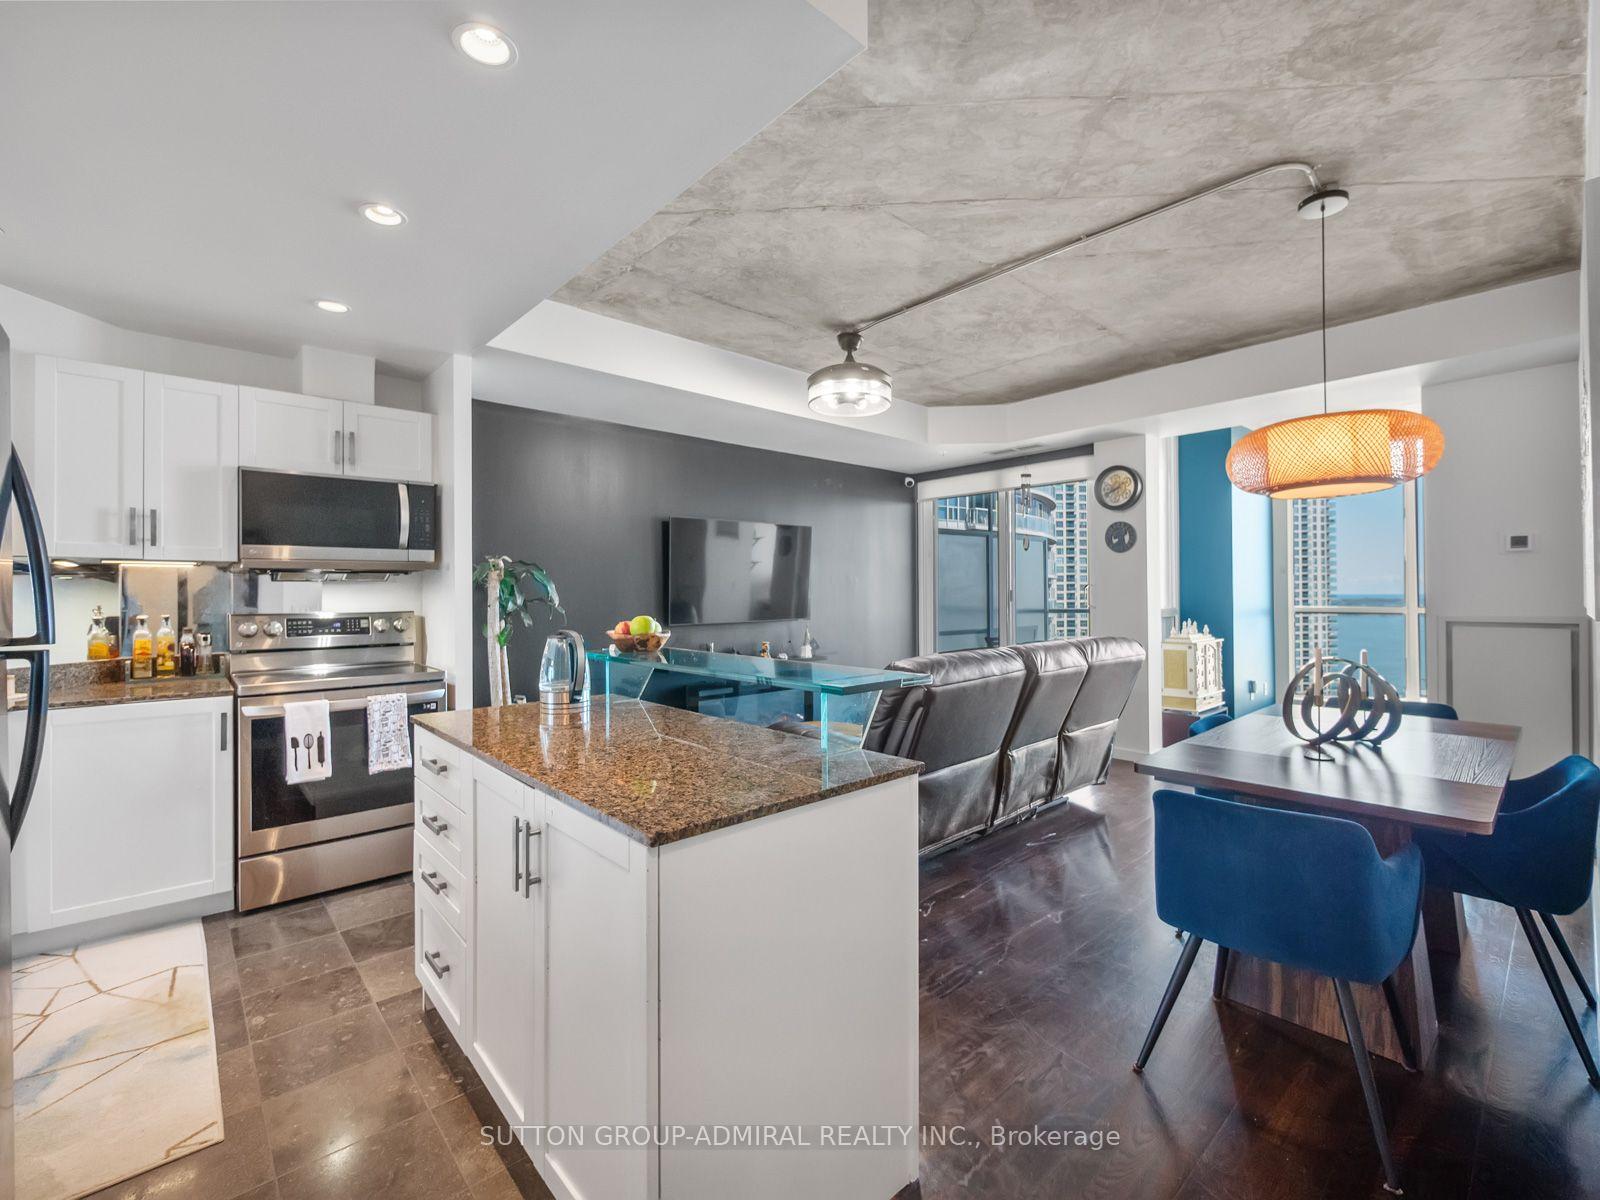
Unit 2103, 218 Queens Quay Boulevard W
Toronto (Waterfront Communities)
Listed 8 days ago
Condo ApartmentFor Sale
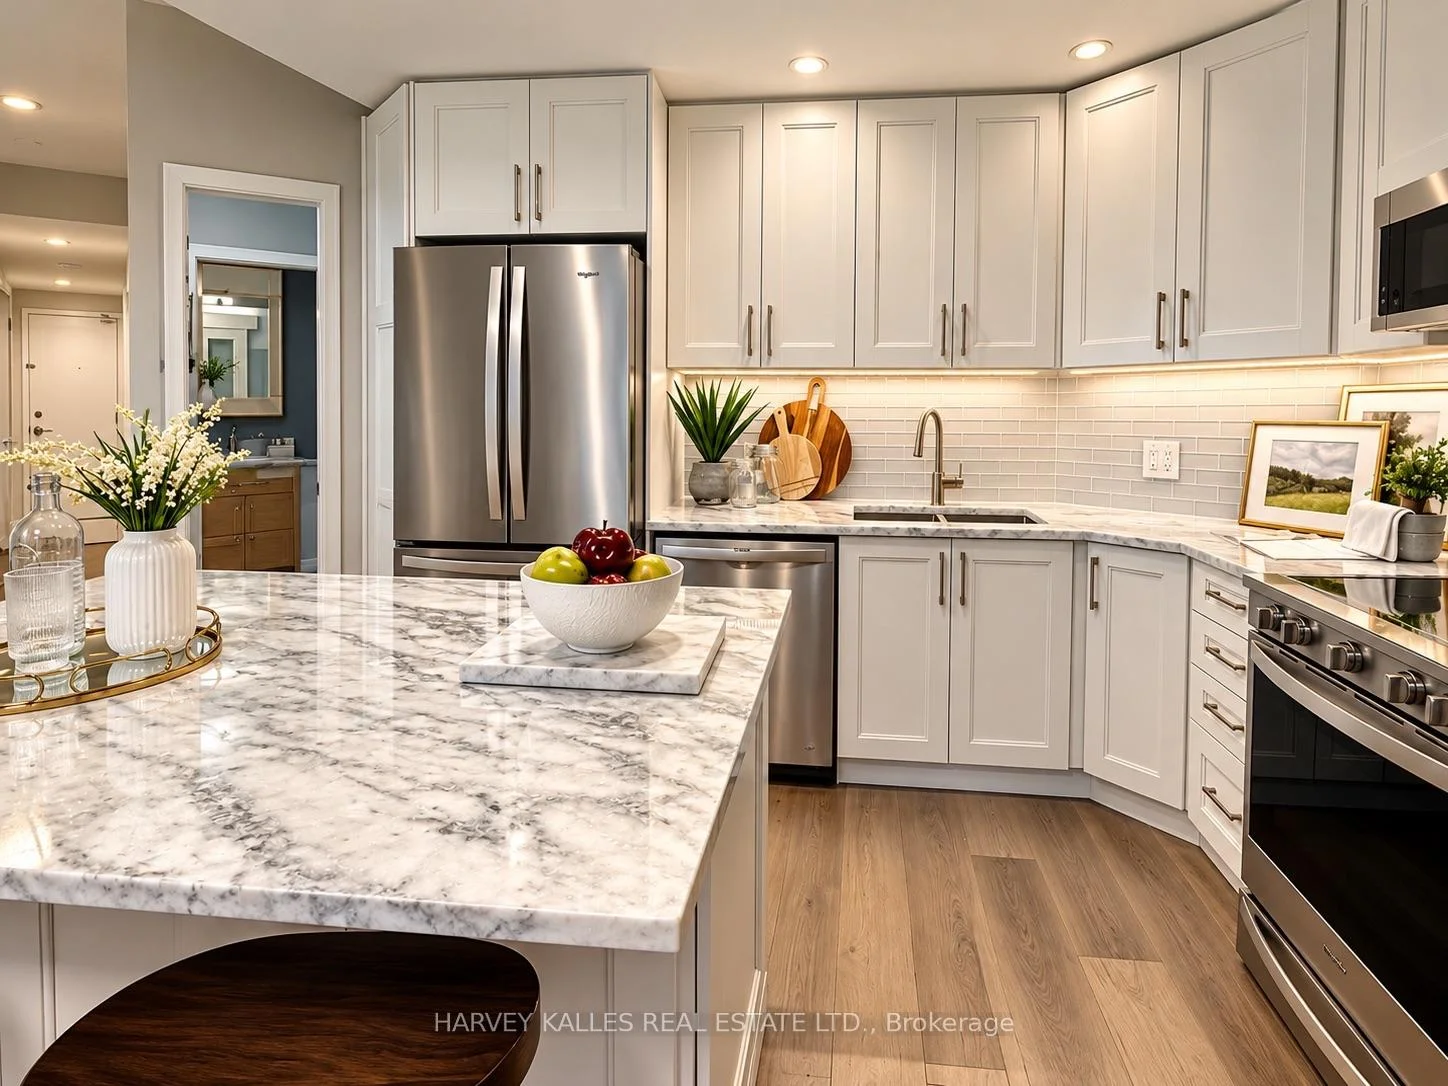
Unit 502, 218 Queens Quay W
Toronto (Waterfront Communities)
Listed Sep 24, 2026
Condo ApartmentFor Sale
2
Units for rent
From $2,500/mo
Live MLS · Updated daily
Following the success of Waterclub I Condos and Waterclub II Condos, the Kolter Group completed its 3-part residential complex in the Lakeshore with the Waterclub III Condos at 218 Queens Quay West. Throughout the Waterclub complex, carefully considered design decisions mean that even after a decade, and many other Lakeshore developments, Toronto condos for sale in this complex remain as attractive ever.
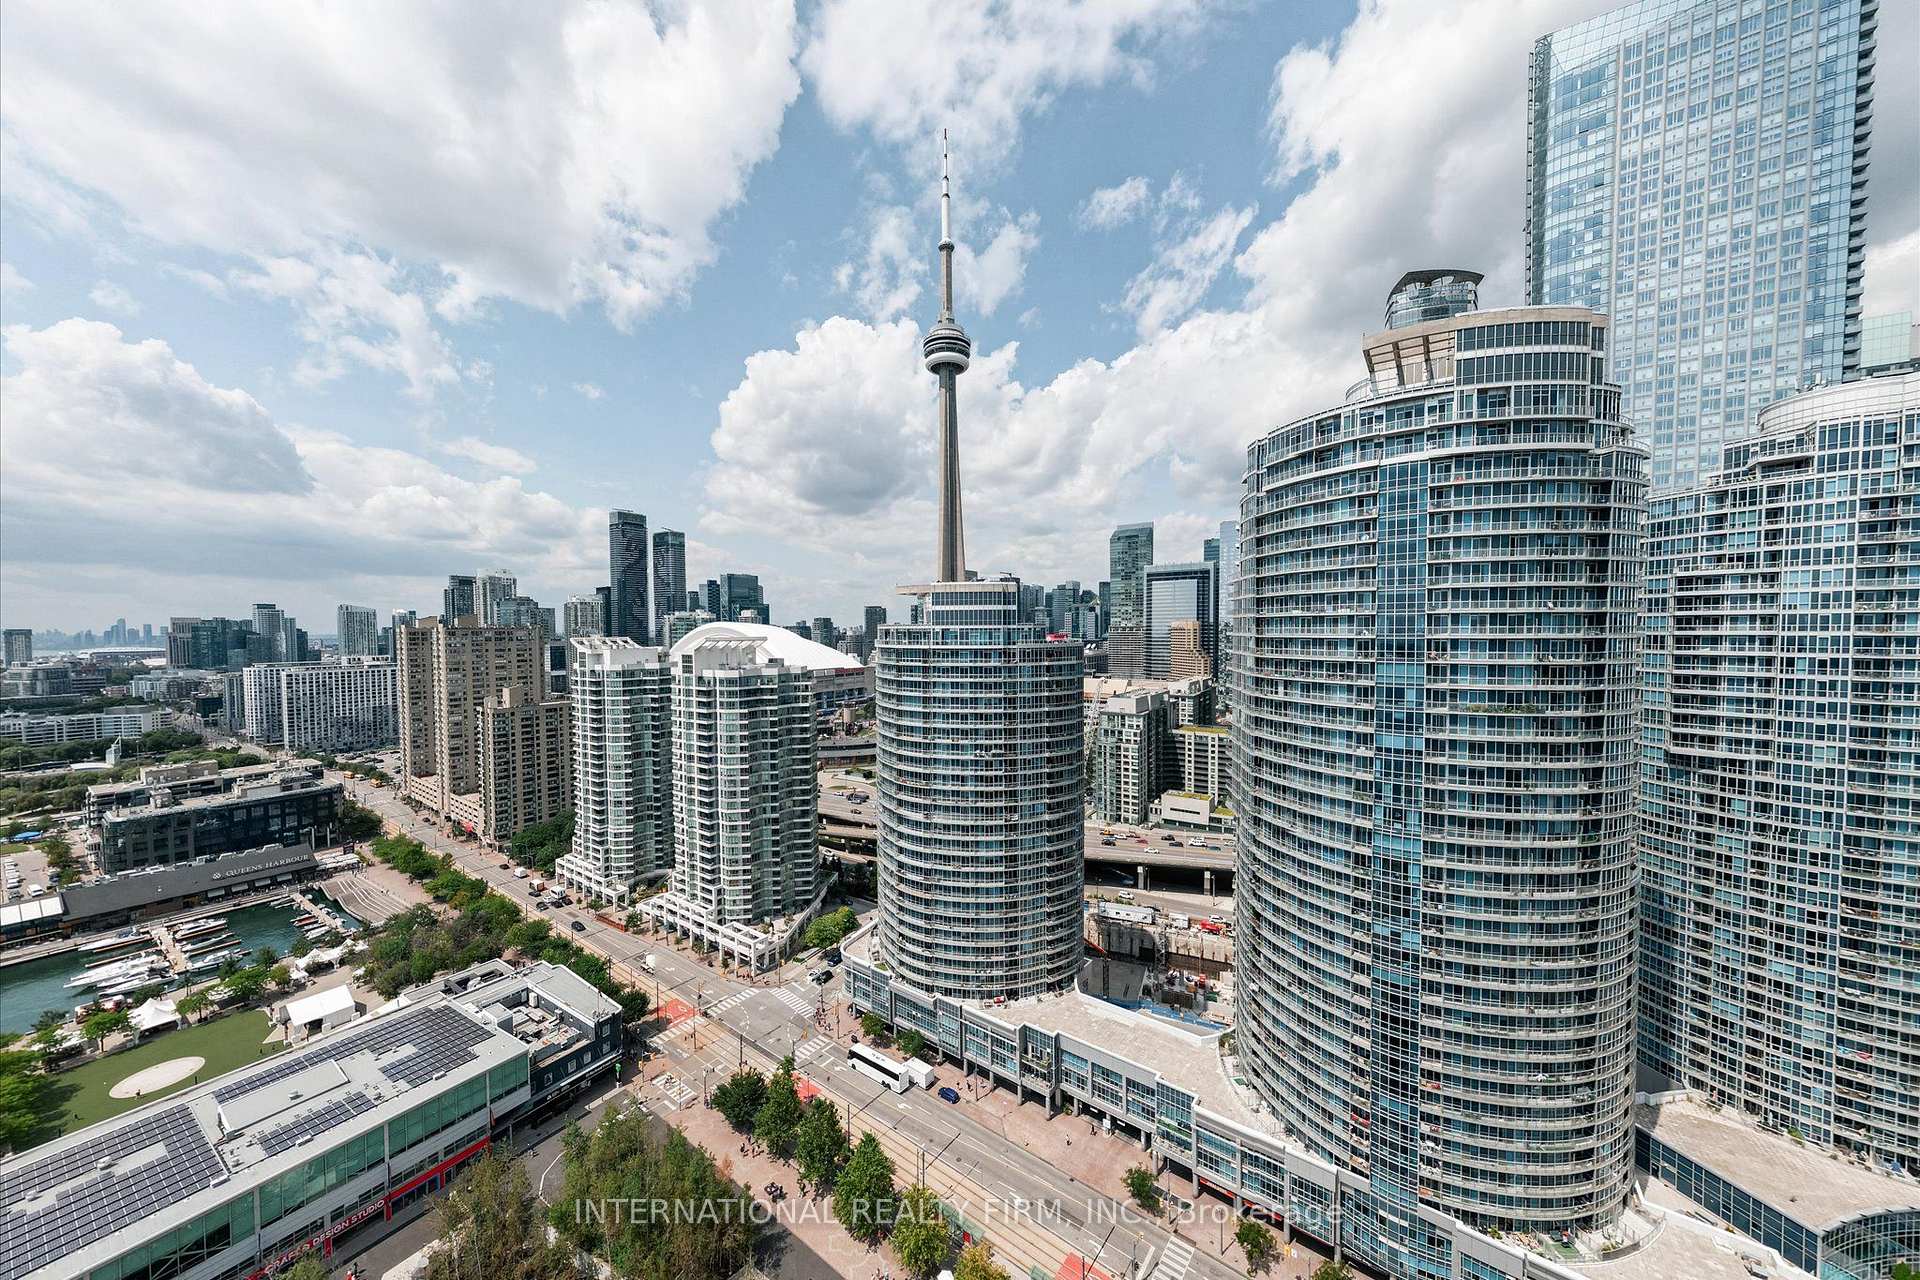
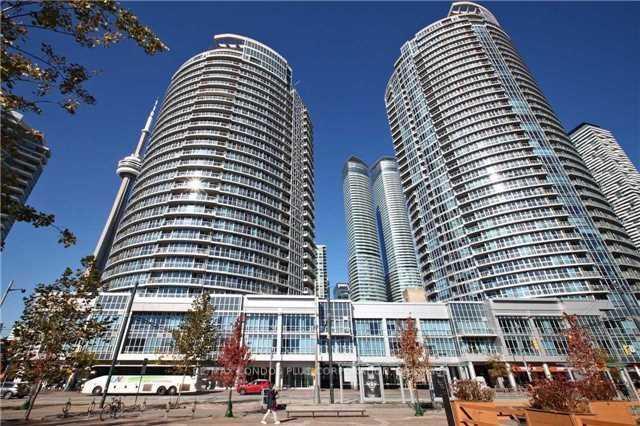
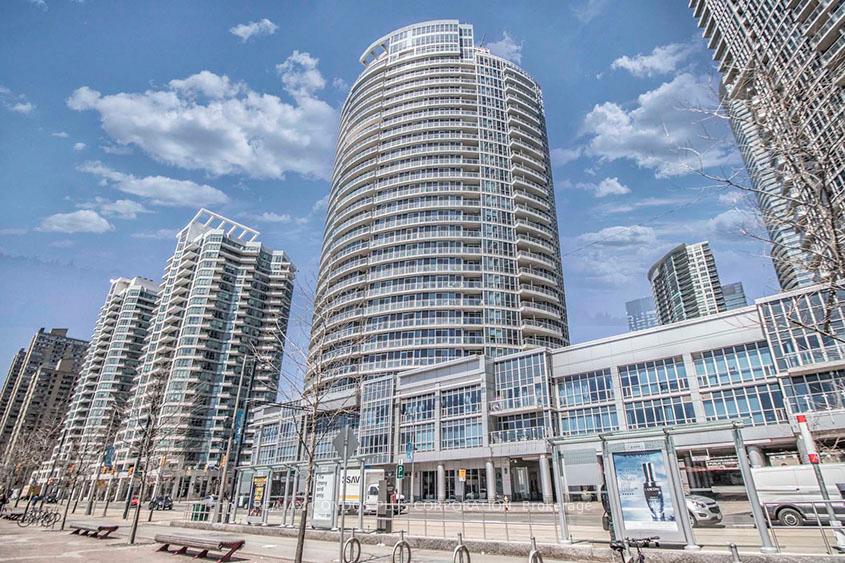
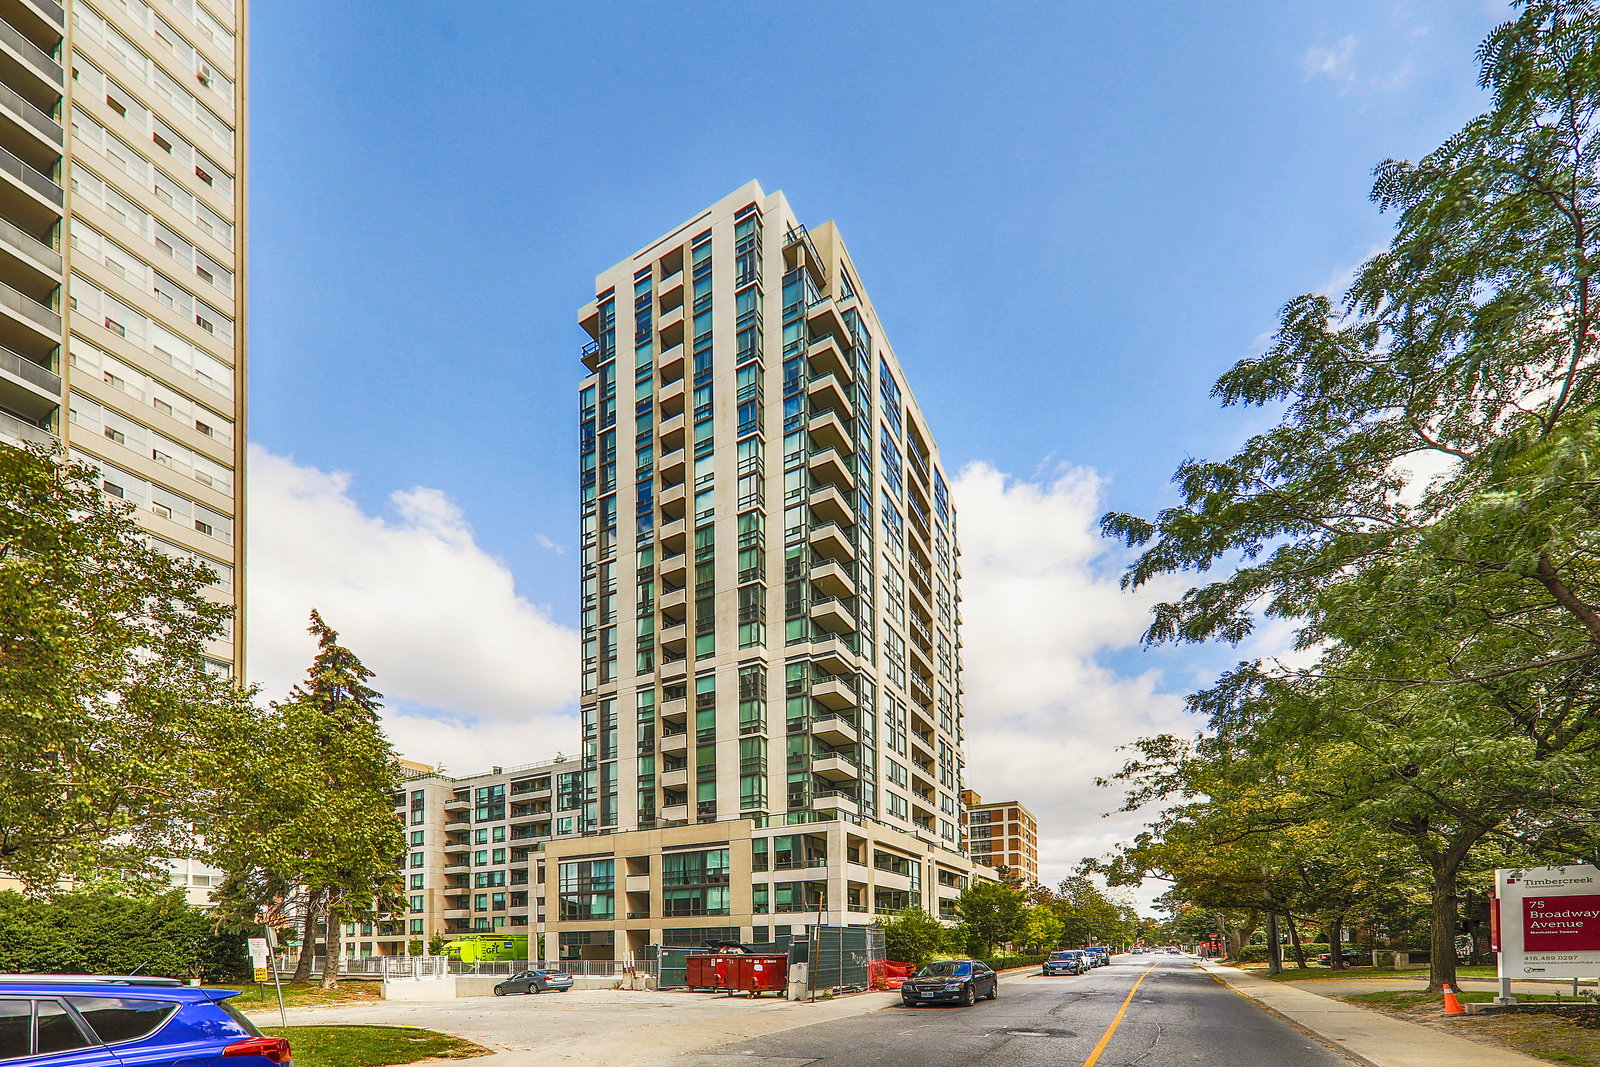
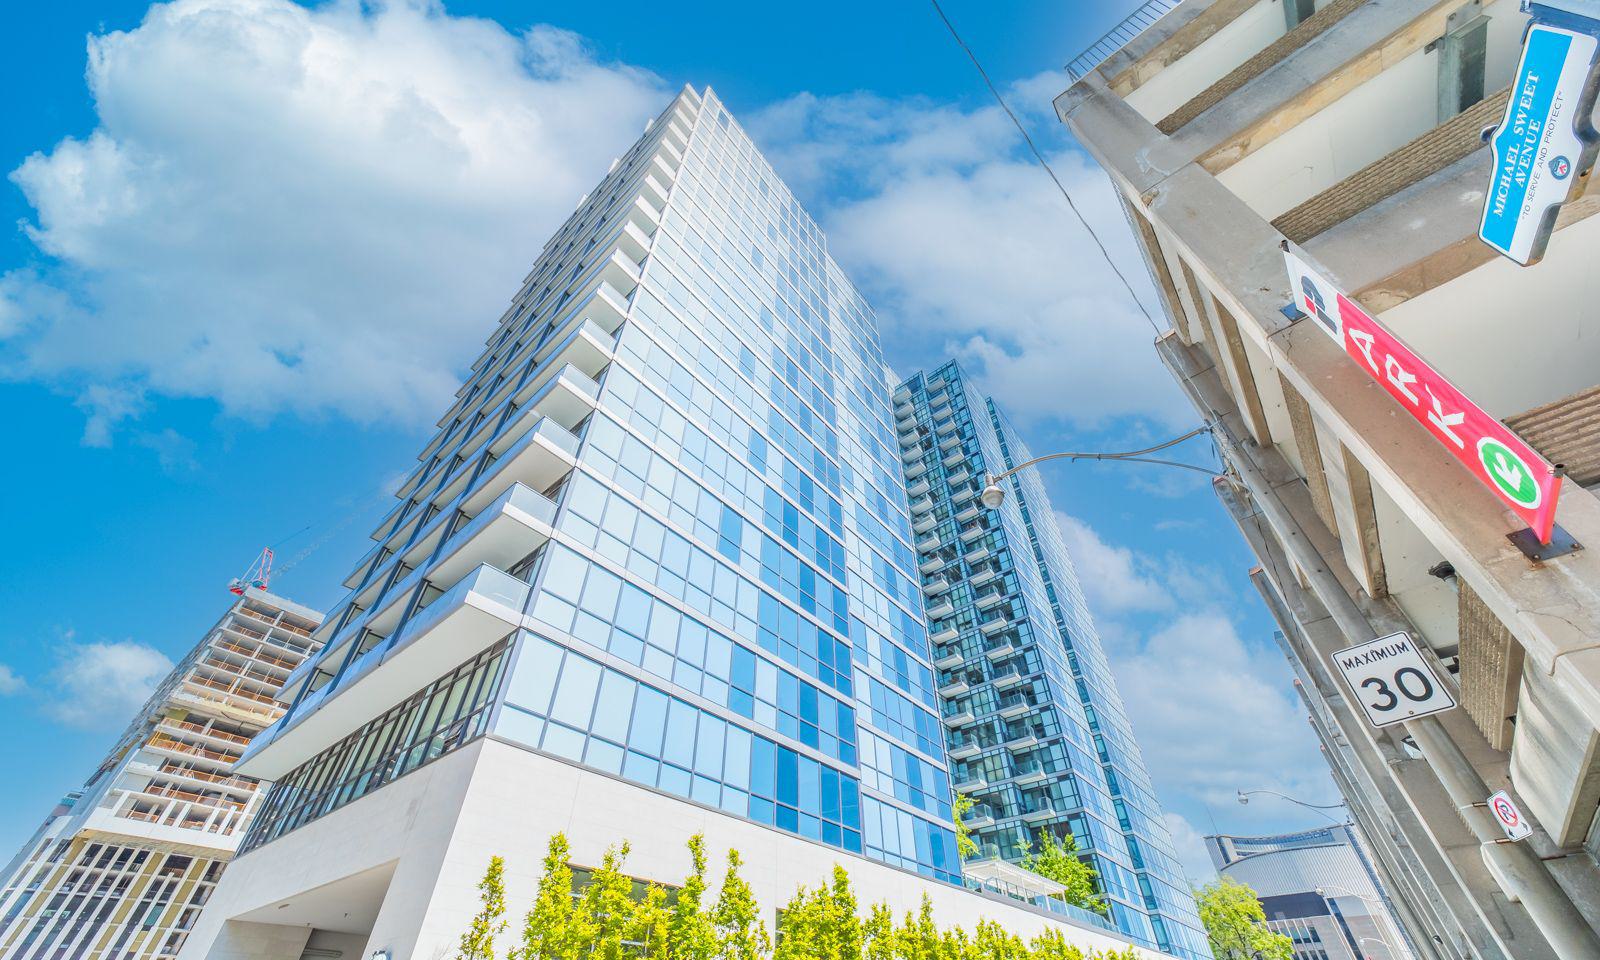
Kirkor Architects and Planners gave the 27-storey tower a smart, contemporary design. The exterior glass and aluminum cleverly captures the natural light reflecting off Lake Ontario. Furthermore, the curve of the Waterclub III Condos’ structure catches the eye: its creative shape is both imaginative and inviting — familiar futurism culminating in the perfect aesthetic for a dynamic community.
Below the tower, and surrounding podium which is shared between the complex, fantastic landscaping can be found. The podium also offers convenient commercial space, and houses top quality amenities.
Accessing the amenities is easy: In the Waterclub III Condos’ gorgeous marble lobby, the condos’ 24-hour concierge staff serves its residents exceptionally. They inform residents of the dynamic classes and services in the complex’s gym and health club — that includes an in-house spa and juice bar — as well as helping residents reserve the multi-purpose room with its own bar, or the exquisite gala space.
Atop the Waterclub complex’s podium, residents enjoy an expansive, gorgeous terrace. While it contains a plethora of seating and even a barbeque area, the best feature on the rooftop is the pool: The Waterclub’s door pool continues inside through a stunning glass wall, which means residents can enjoy swimming here no matter the season.
Developer
Kolter Group
Year Built
2005
Property Type
High-Rise Condo
Storeys
27
Total Units
296
Management
ICC Property Management Toronto
Underground Parking
Rec Room
Indoor Pool
Guest Suites
Fitness Centre
Outdoor Pool
Party Room
24/7 Concierge
$837
Avg $/sqft
-3.7%
YoY change
68
Avg days on market
Walk Score
94/100
Daily errands on foot
Transit Score
100/100
TTC, GO, subway access
Bike Score
73/100
Bike lanes & infrastructure
Neighbourhood in Toronto
The Waterfront is a vibrant neighbourhood in Toronto. It offers a mix of parks, restaurants, and schools.
Median asking price
In Ontario
$716,900
Median monthly rent
In Ontario
$2,499
For sale
0
For rent
0
Recently sold
Sign in to see sold data
Recently leased
Sign in to see leased data
Market data as of 2026-08-16. Sold and leased figures are neighbourhood medians over the last 12 months, published only where at least 5 homes closed — never a single sale.
What people love
Keep in mind
Daily life here is active and social, with many dining and leisure options. The area is family-friendly and caters to various lifestyles.
Not enough verified data yet. We count schools, parks, transit and shops inside The Waterfront's real boundary and publish the numbers only once that count is confirmed — an estimate here would be worse than nothing.
1,549
Population (2021)
0.0 km²
Area
42,092
People per km²
38.4
Median age
$95,000
Median income
52%
Own their home
1.6
People per household
980
Households
Every age
What is built here
Own or rent
52%Owners
48%Renters
Across 980 households
When it was built
Mostly 1981–1990
Share of occupied homes, by the era they were built in. Bars are drawn against the busiest era, not against each other, because the eras are not the same length. The eight shares are unlikely to total exactly 100: Statistics Canada rounds each era's count to the nearest 5 before publishing it, so we print what the census reports rather than adjusting a figure to make the column add up.
Statistics Canada, Census of Population 2021. Added up from 1 census area around the listings we hold here. Medians and rates are a population-weighted average of dissemination-area figures.
Sources: HOMEH listings, Statistics Canada, Census of Population 2021, OpenStreetMap, © OpenStreetMap contributors (ODbL)