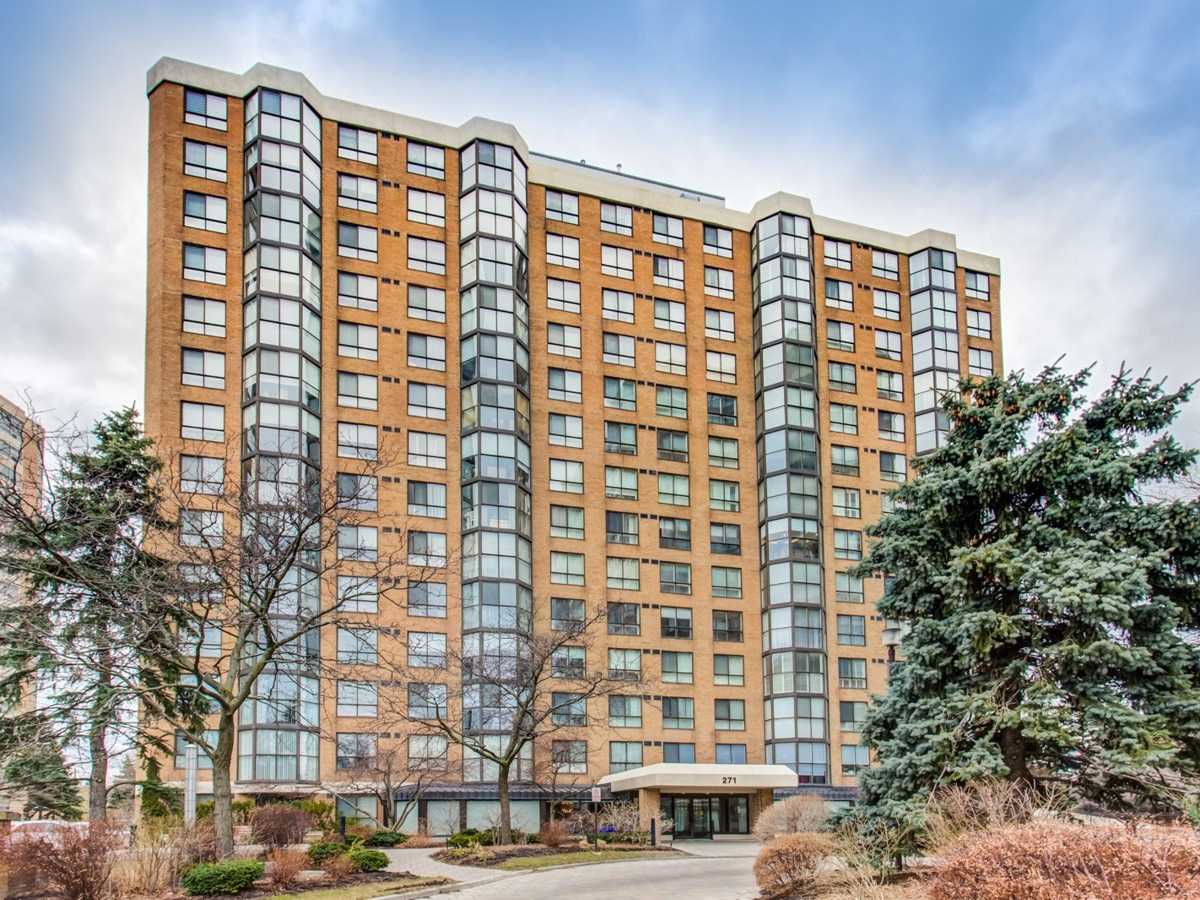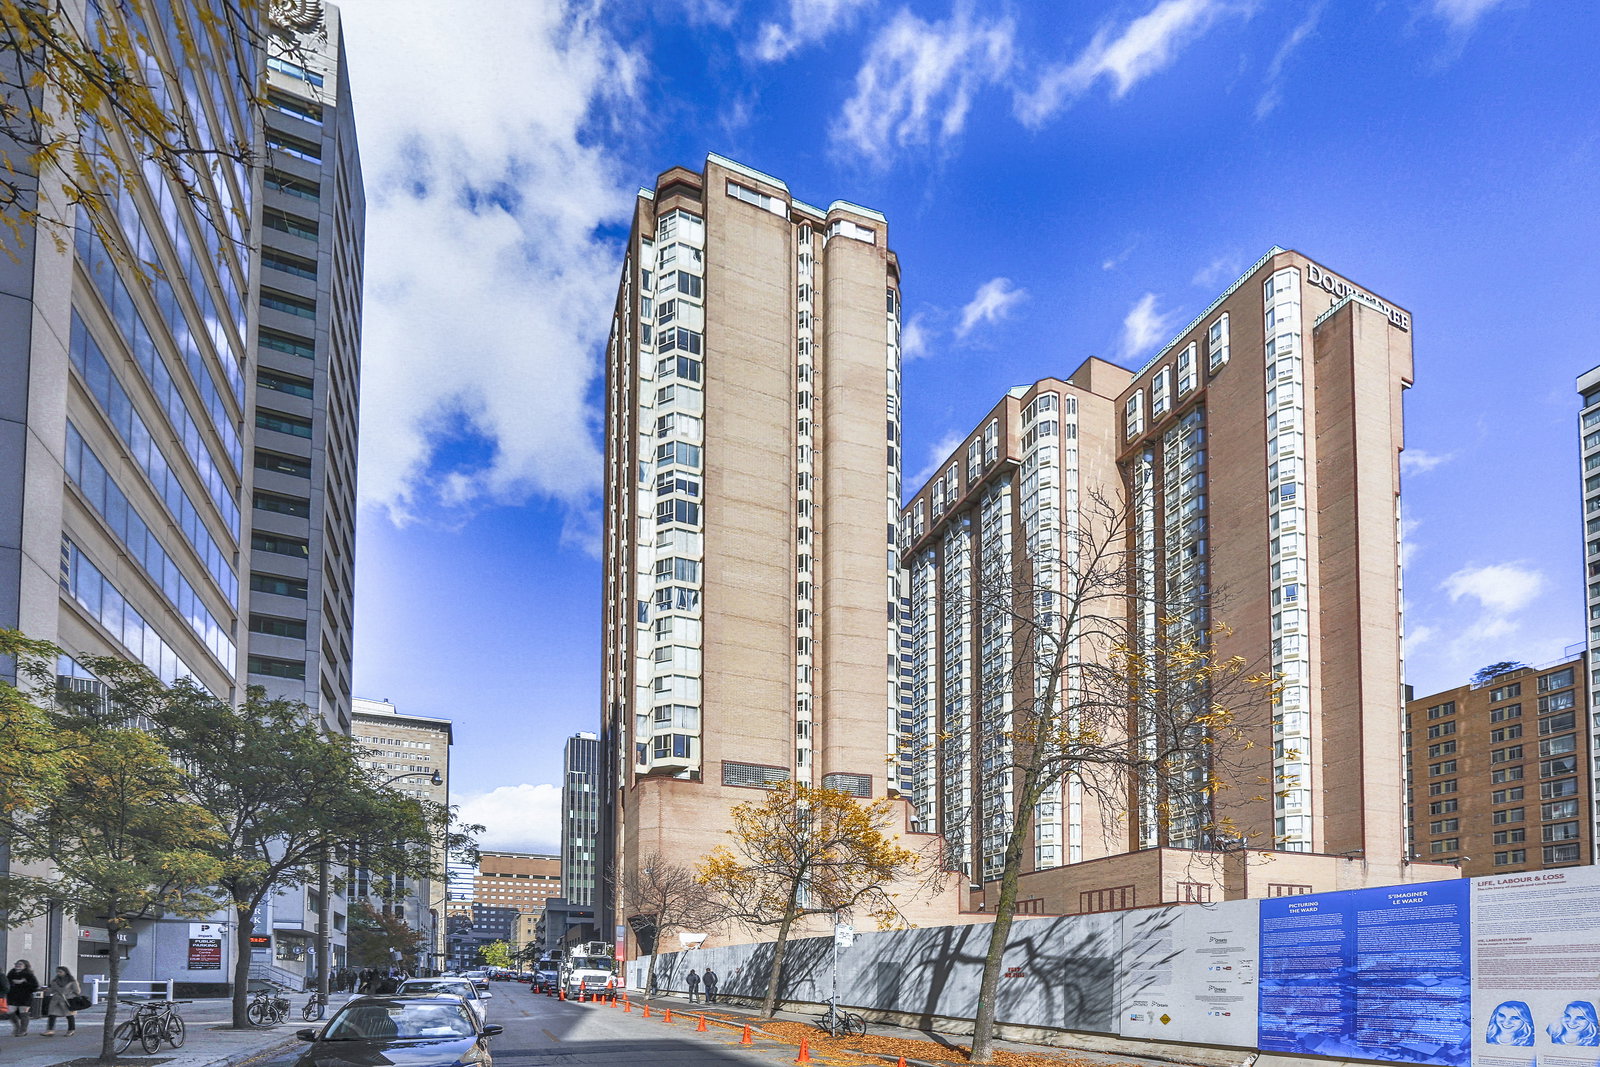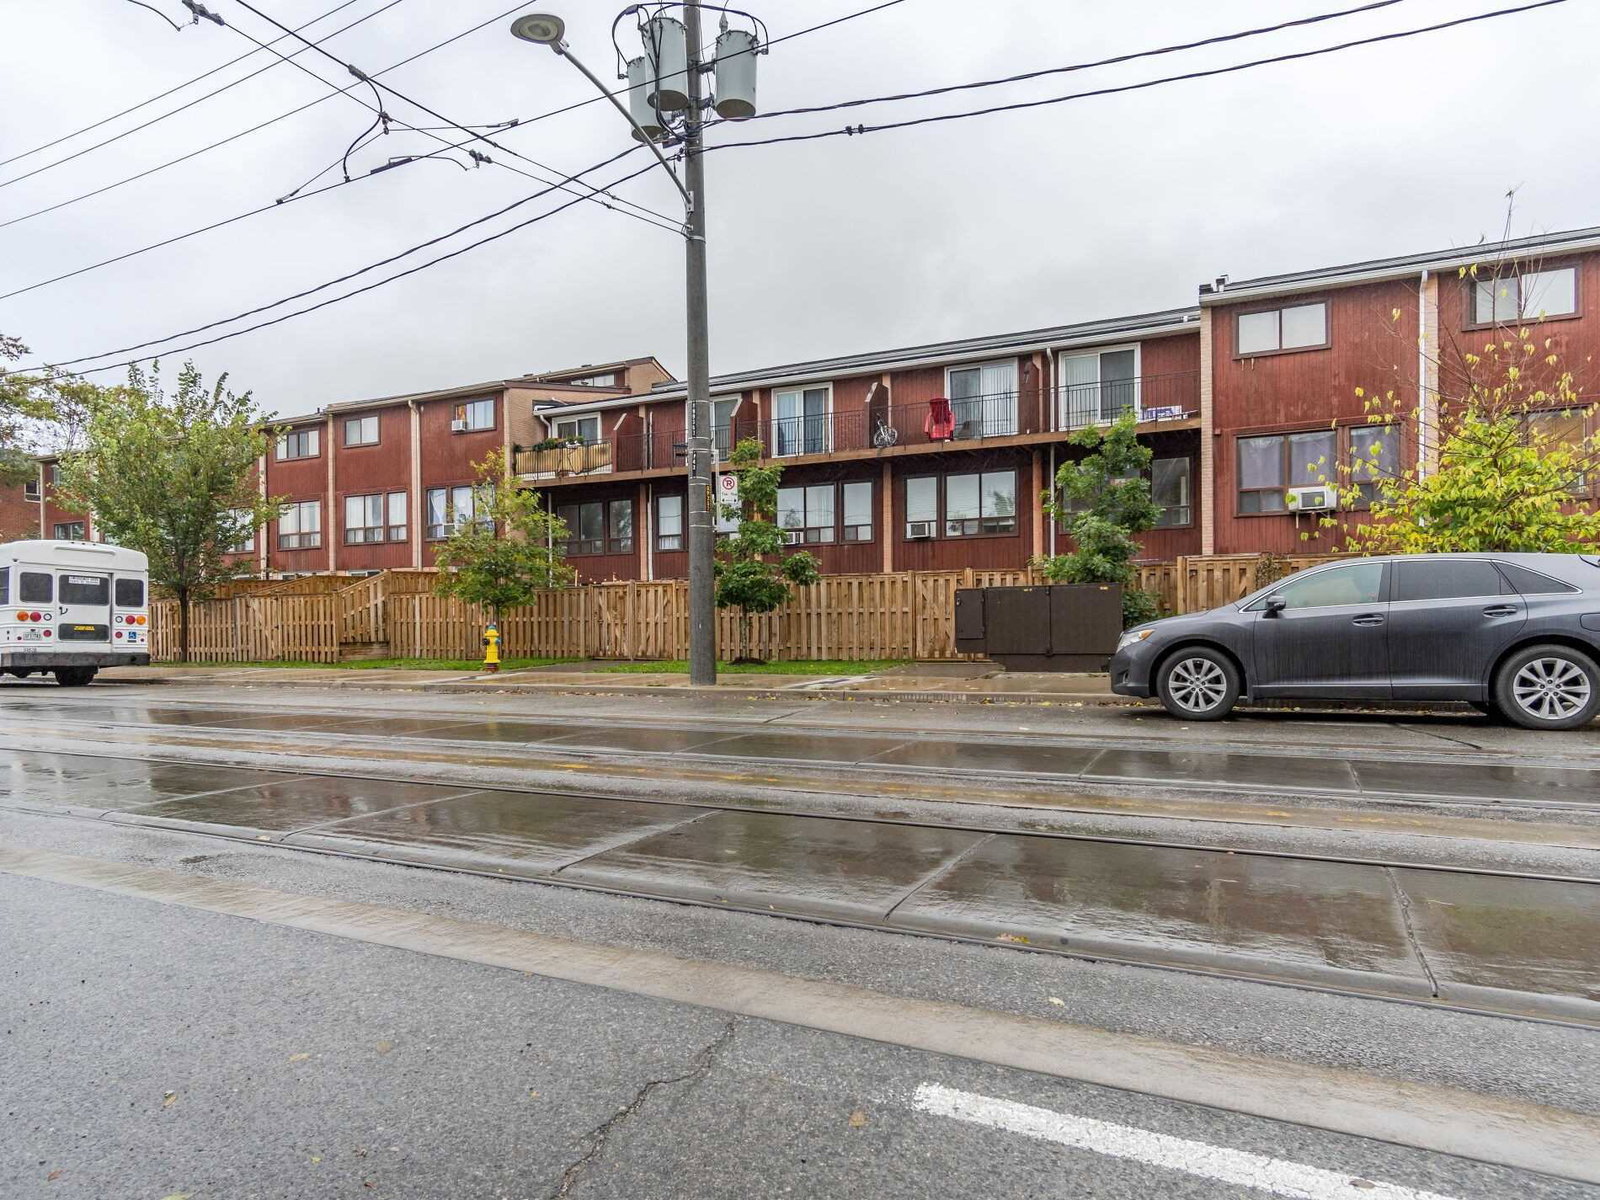
Year Built
1986
by Huang and Danczkay Ltd.
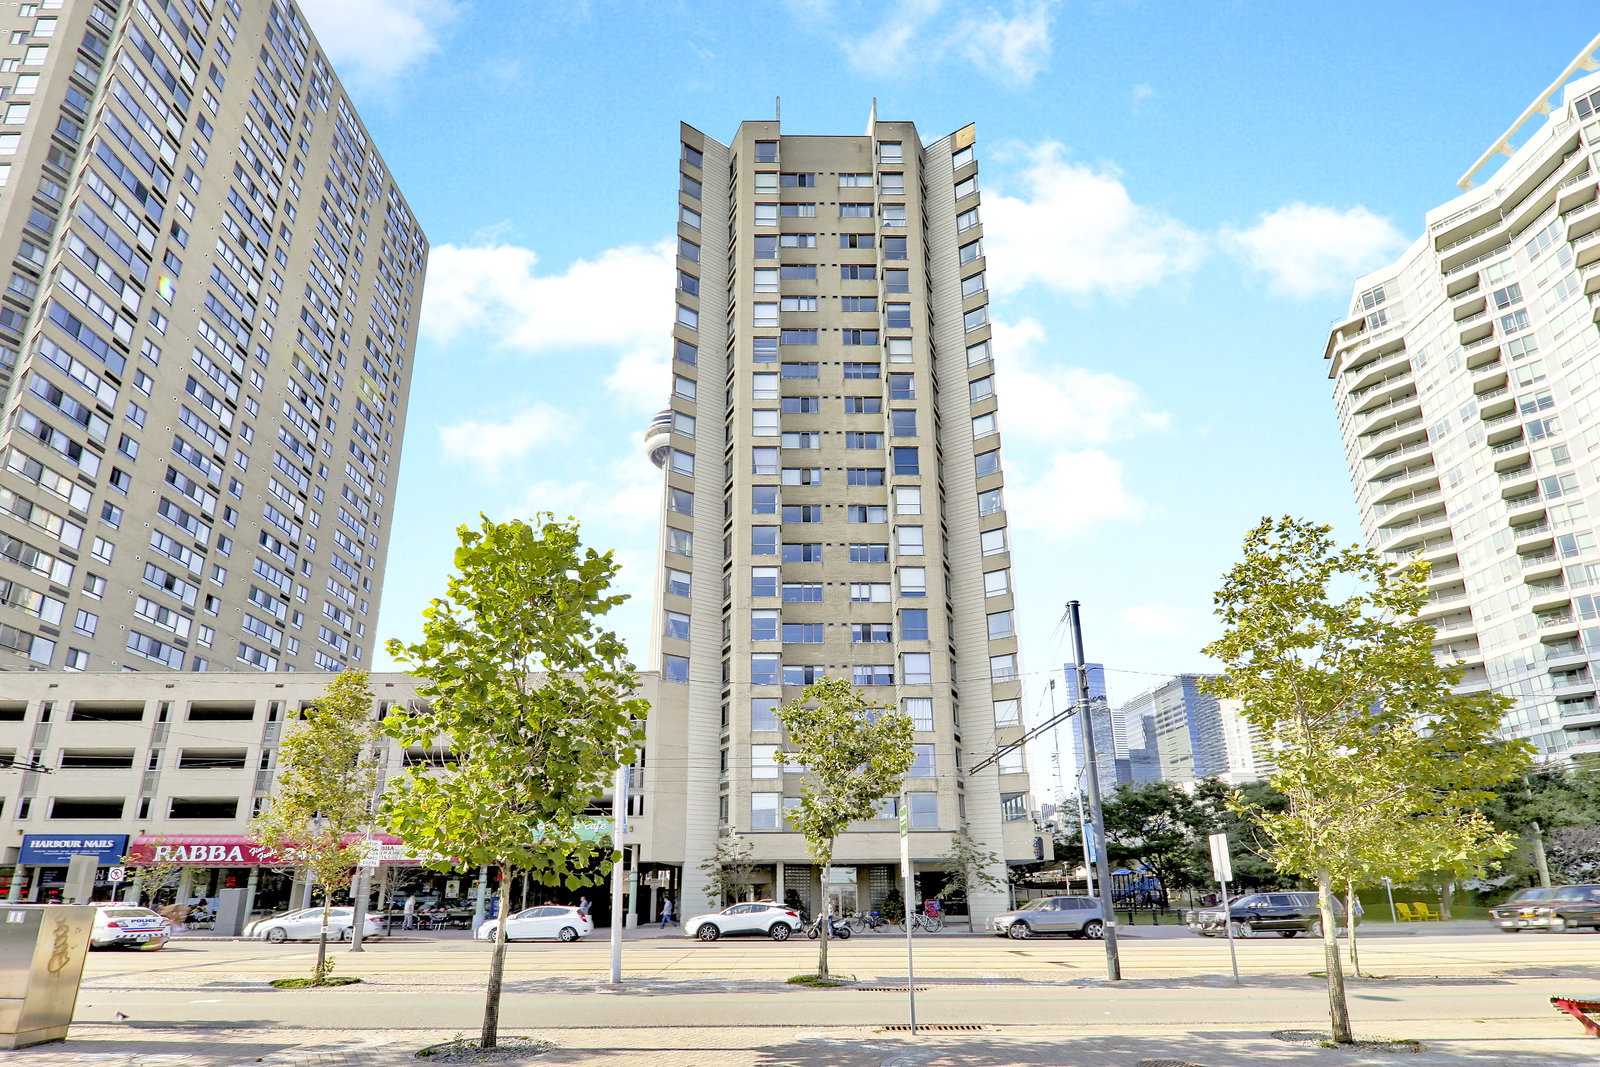
250 Queens Quay W, Toronto, ON M5J 2N2
Year Built
1986
Total Units
134
Avg $/sqft
$622
Storeys
18
2
Units for sale
From $585,000
1
Unit for rent
From $2,870/mo
Live MLS · Updated daily
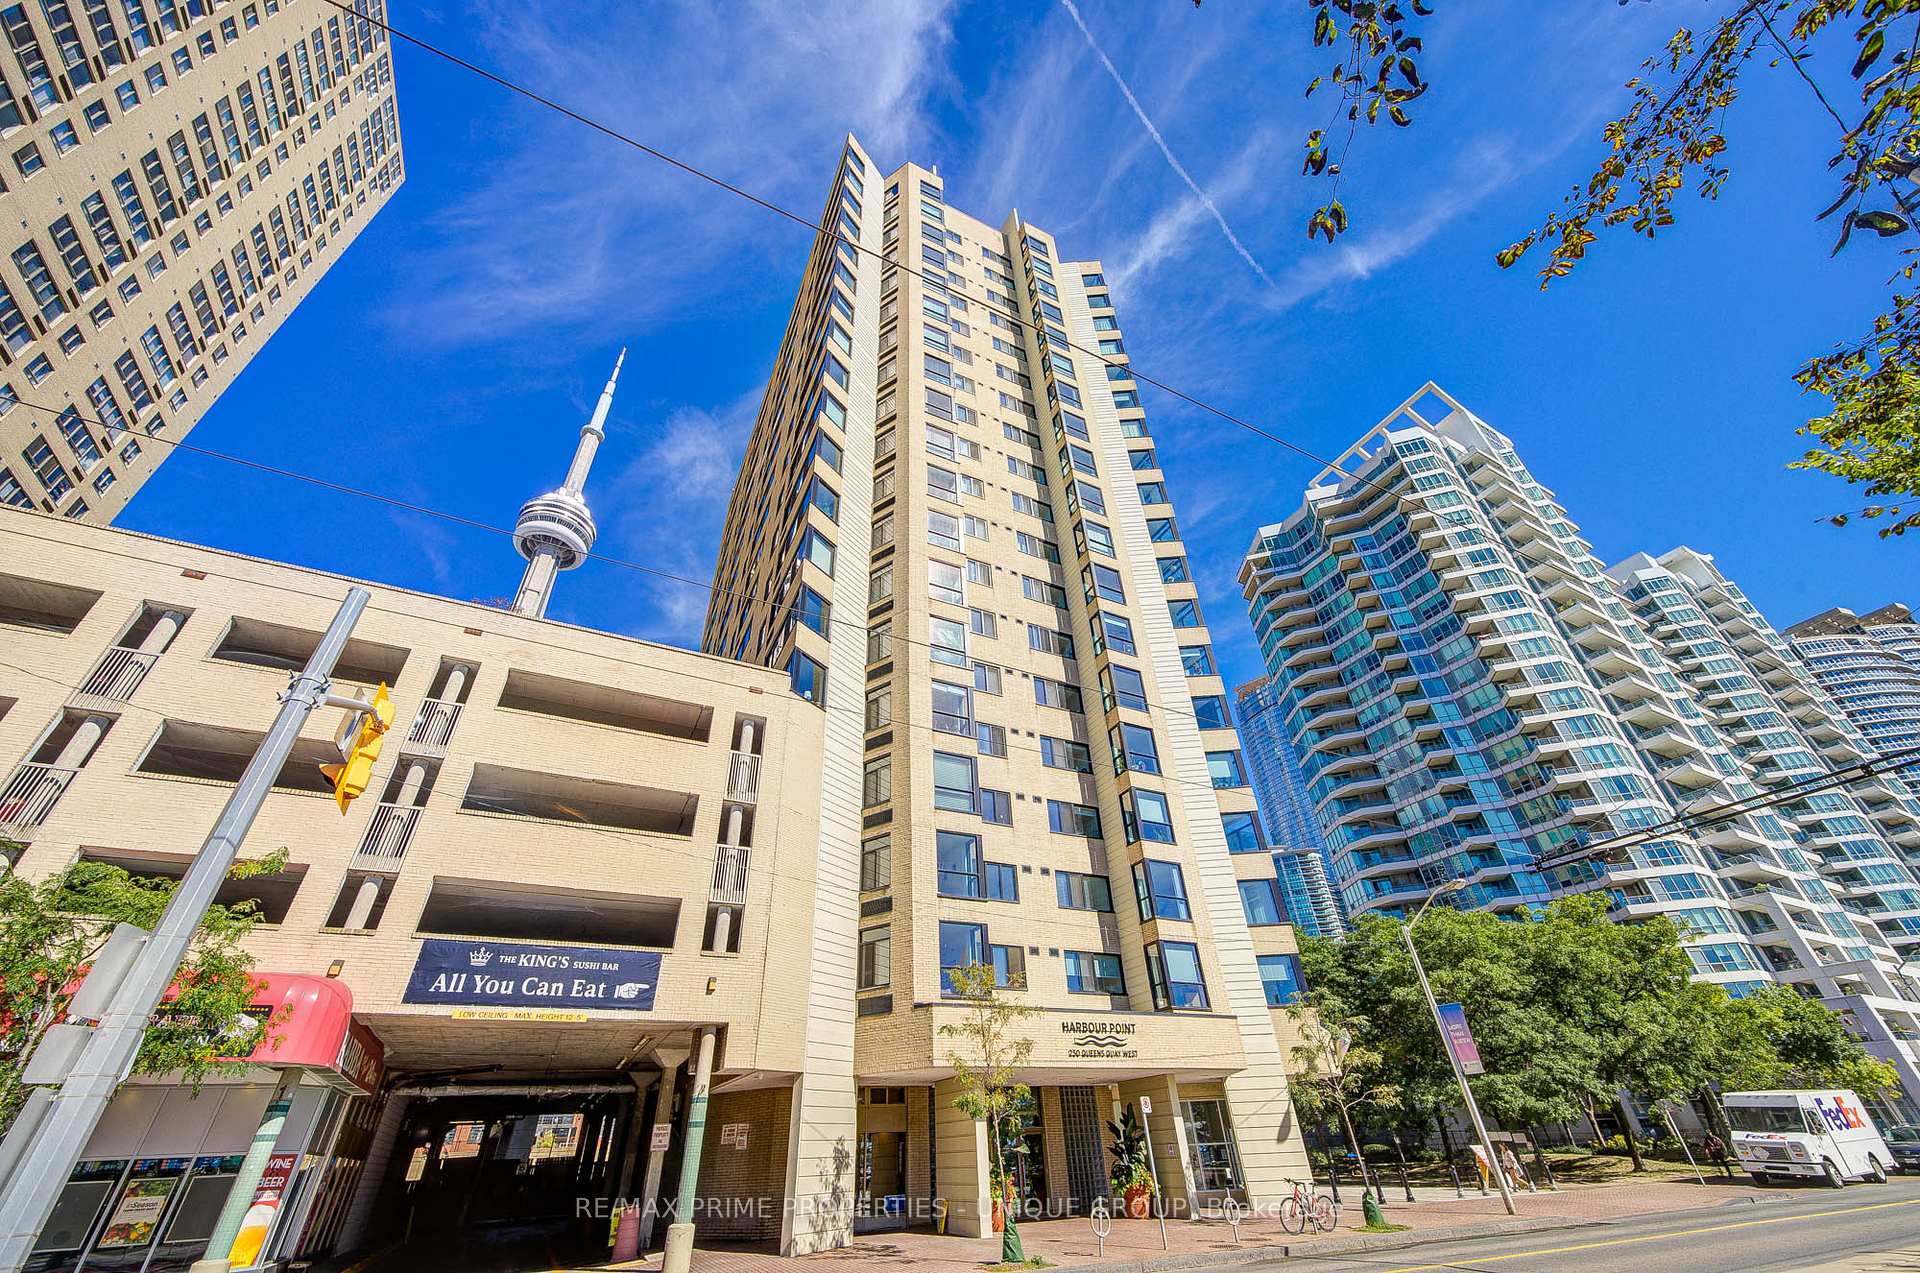
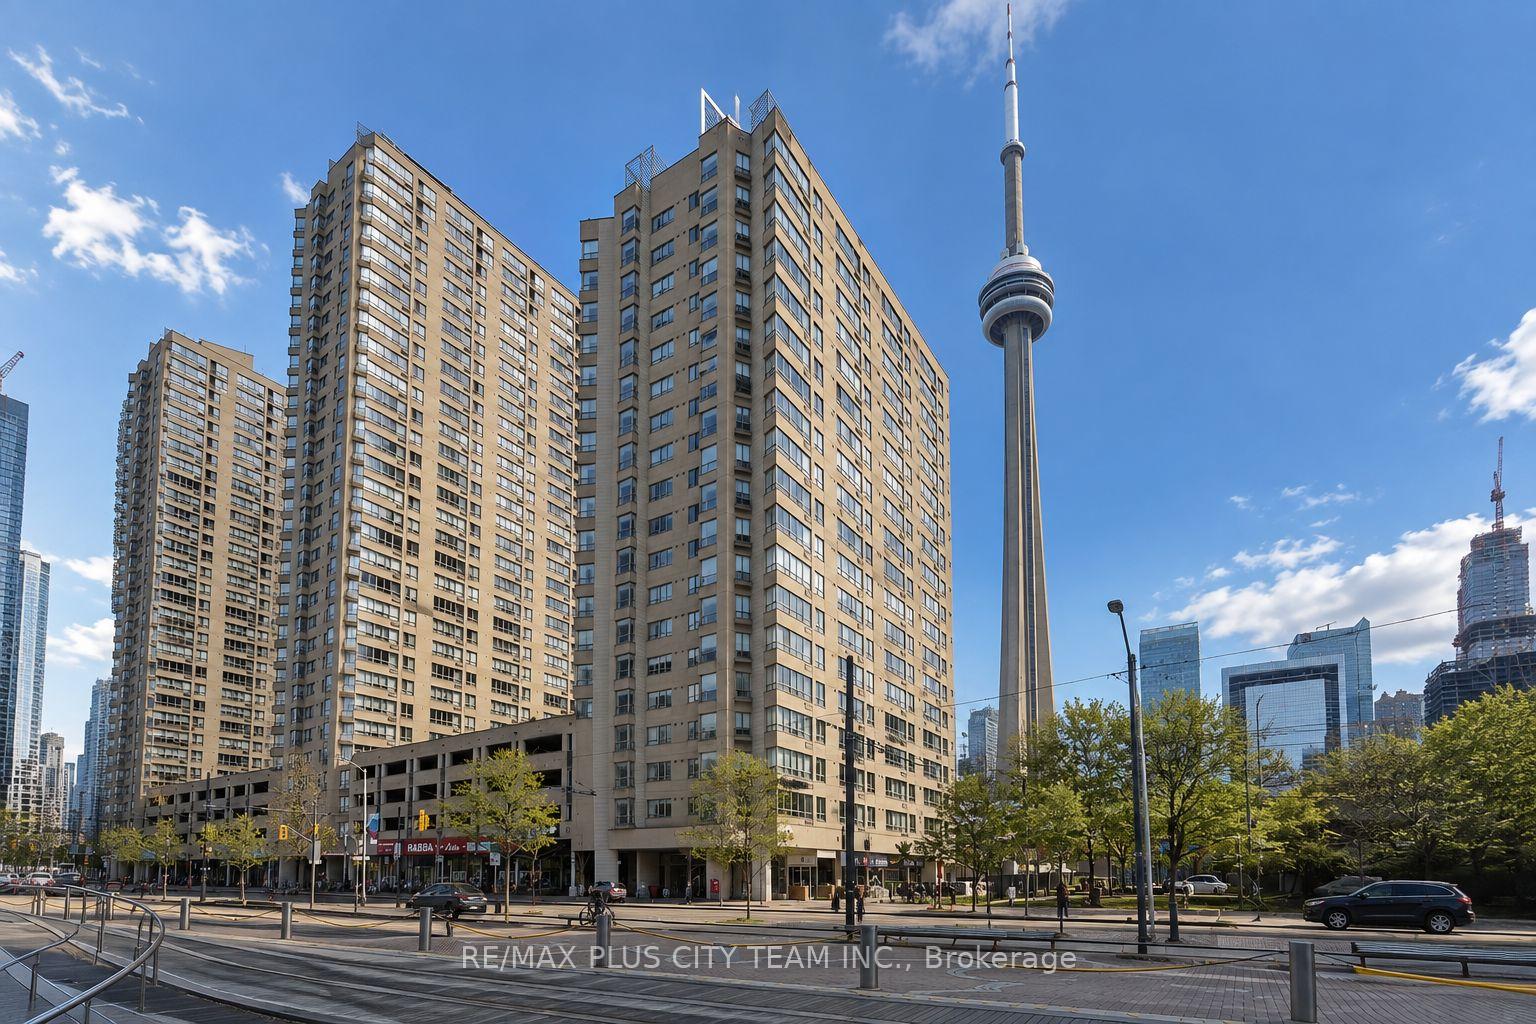
Anyone who’s seeking a Toronto condo for sale should definitely consider Harbourpoint I Condos at 250 Queens Quay W. Huang and Danczkay Ltd. completed this building back in 1986, but unlike other buildings of that age, maintenance fees are actually on the higher end at $0.98 per-square-foot. The building is 18 storeys tall and is home to 134 suites. Units start at 750 square feet on the low end, and can go up to 900 square feet.
This condo is very conveniently located, with a well above average Walk Score of 93 and an average demand ranking, based on Strata.ca’s analytics. Maintenance fees at 250 Queens Quay W are $0.98 per-square-foot, which is significantly higher than the city average of about $0.67.
Developer
Huang and Danczkay Ltd.
Year Built
1986
Property Type
Mid-Rise Condo
Storeys
18
Total Units
134
Management
Brilliant Property Management
Underground Parking
Guest Suites
Fitness Centre
Sauna
Rooftop Garden
BBQ Area
24/7 Concierge
$622
Avg $/sqft
-19.2%
YoY change
20
Avg days on market
Walk Score
93/100
Daily errands on foot
Transit Score
100/100
TTC, GO, subway access
Bike Score
75/100
Bike lanes & infrastructure
Neighbourhood in Toronto
The Waterfront is a vibrant neighbourhood in Toronto. It offers a mix of parks, restaurants, and schools.
Median asking price
In Ontario
$716,900
Median monthly rent
In Ontario
$2,499
For sale
0
For rent
0
Recently sold
Sign in to see sold data
Recently leased
Sign in to see leased data
Market data as of 2026-08-16. Sold and leased figures are neighbourhood medians over the last 12 months, published only where at least 5 homes closed — never a single sale.
What people love
Keep in mind
Daily life here is active and social, with many dining and leisure options. The area is family-friendly and caters to various lifestyles.
Not enough verified data yet. We count schools, parks, transit and shops inside The Waterfront's real boundary and publish the numbers only once that count is confirmed — an estimate here would be worse than nothing.
1,549
Population (2021)
0.0 km²
Area
42,092
People per km²
38.4
Median age
$95,000
Median income
52%
Own their home
1.6
People per household
980
Households
Every age
What is built here
Own or rent
52%Owners
48%Renters
Across 980 households
When it was built
Mostly 1981–1990
Share of occupied homes, by the era they were built in. Bars are drawn against the busiest era, not against each other, because the eras are not the same length. The eight shares are unlikely to total exactly 100: Statistics Canada rounds each era's count to the nearest 5 before publishing it, so we print what the census reports rather than adjusting a figure to make the column add up.
Statistics Canada, Census of Population 2021. Added up from 1 census area around the listings we hold here. Medians and rates are a population-weighted average of dissemination-area figures.
Sources: HOMEH listings, Statistics Canada, Census of Population 2021, OpenStreetMap, © OpenStreetMap contributors (ODbL)