Year Built
2013
by Urban Capital Property Group
51 Trolley Crescent, Toronto, ON M5A0E9
Year Built
2013
Total Units
345
Avg $/sqft
$866
Storeys
16
3
Units for sale
From $449,900
Listed Jun 26, 2026
Unit 603, 51 Trolley Crescent
Toronto (Moss Park), ON M5A 0E9
Condo ApartmentFor Sale
2
Units for rent
From $2,150/mo
Live MLS · Updated daily
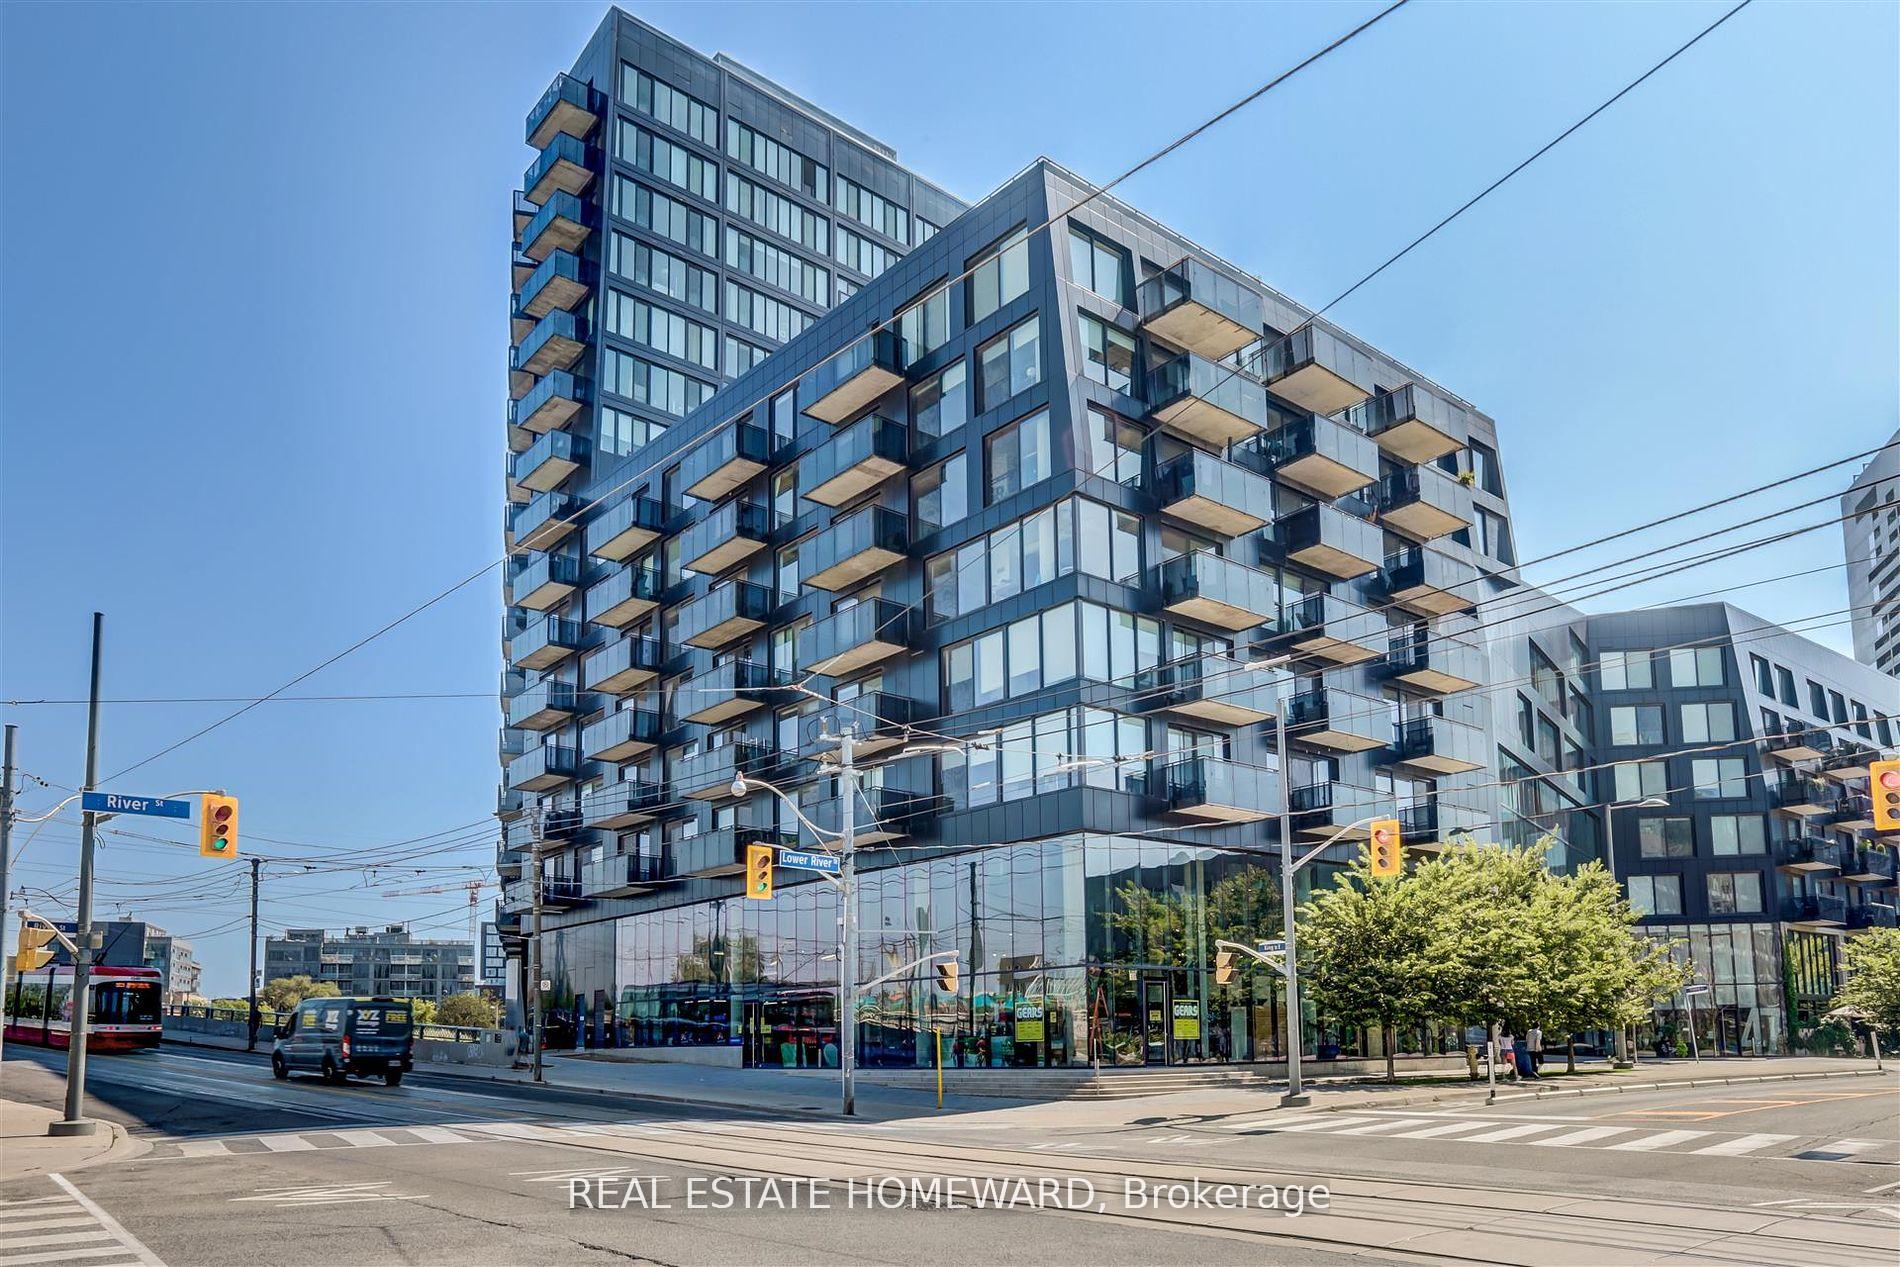
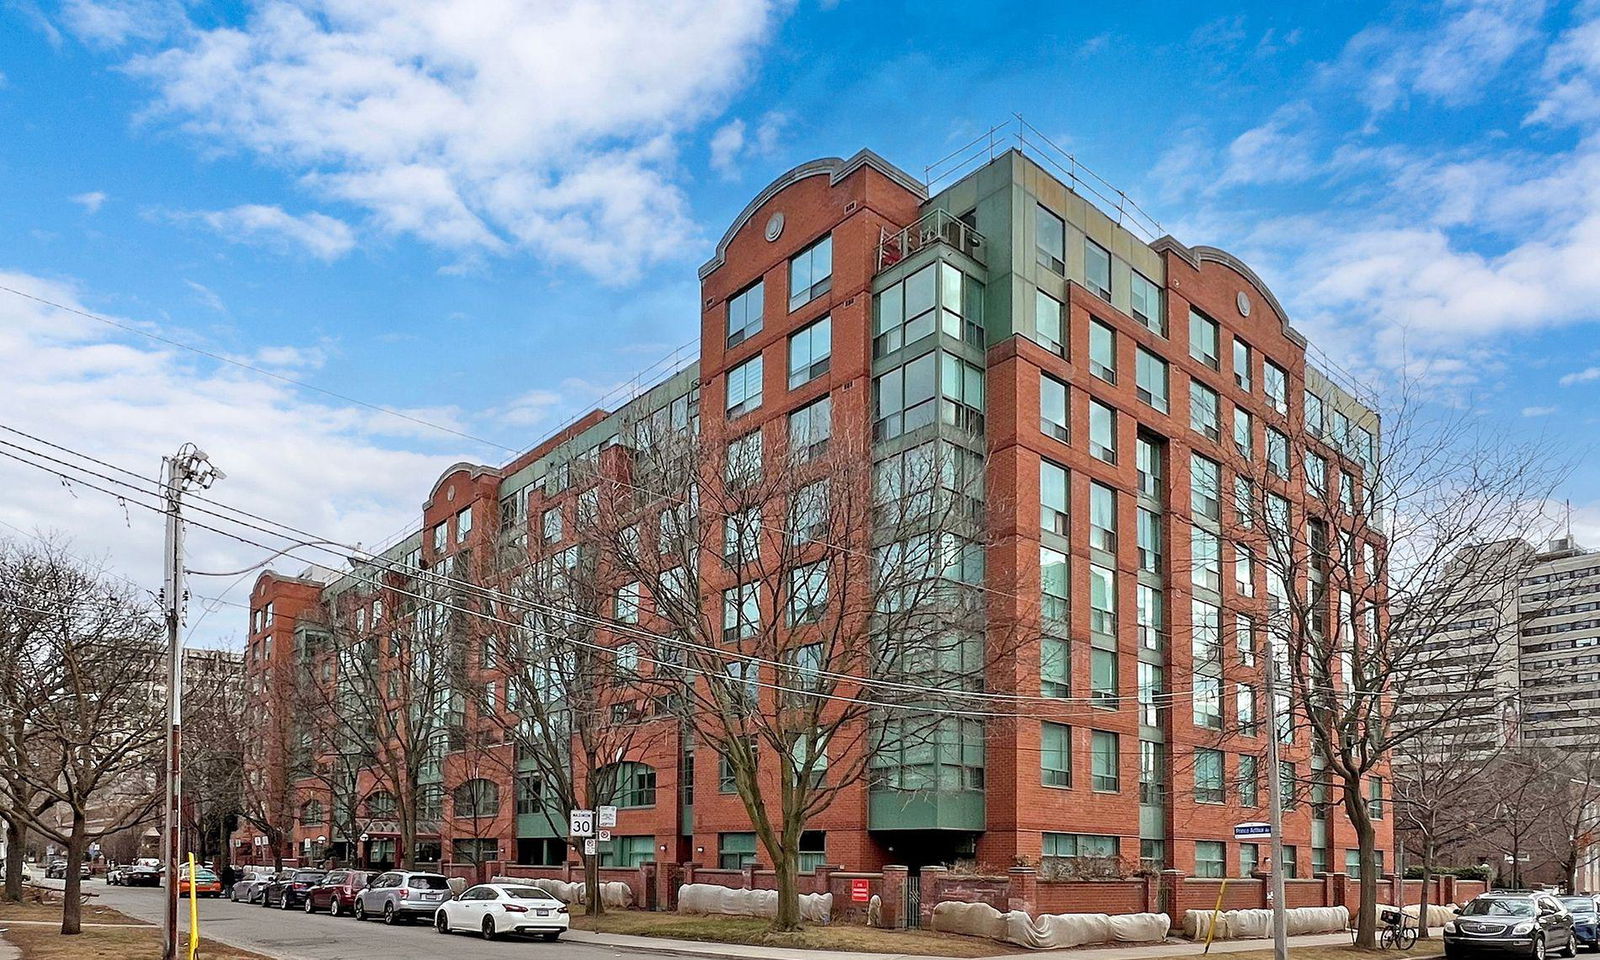
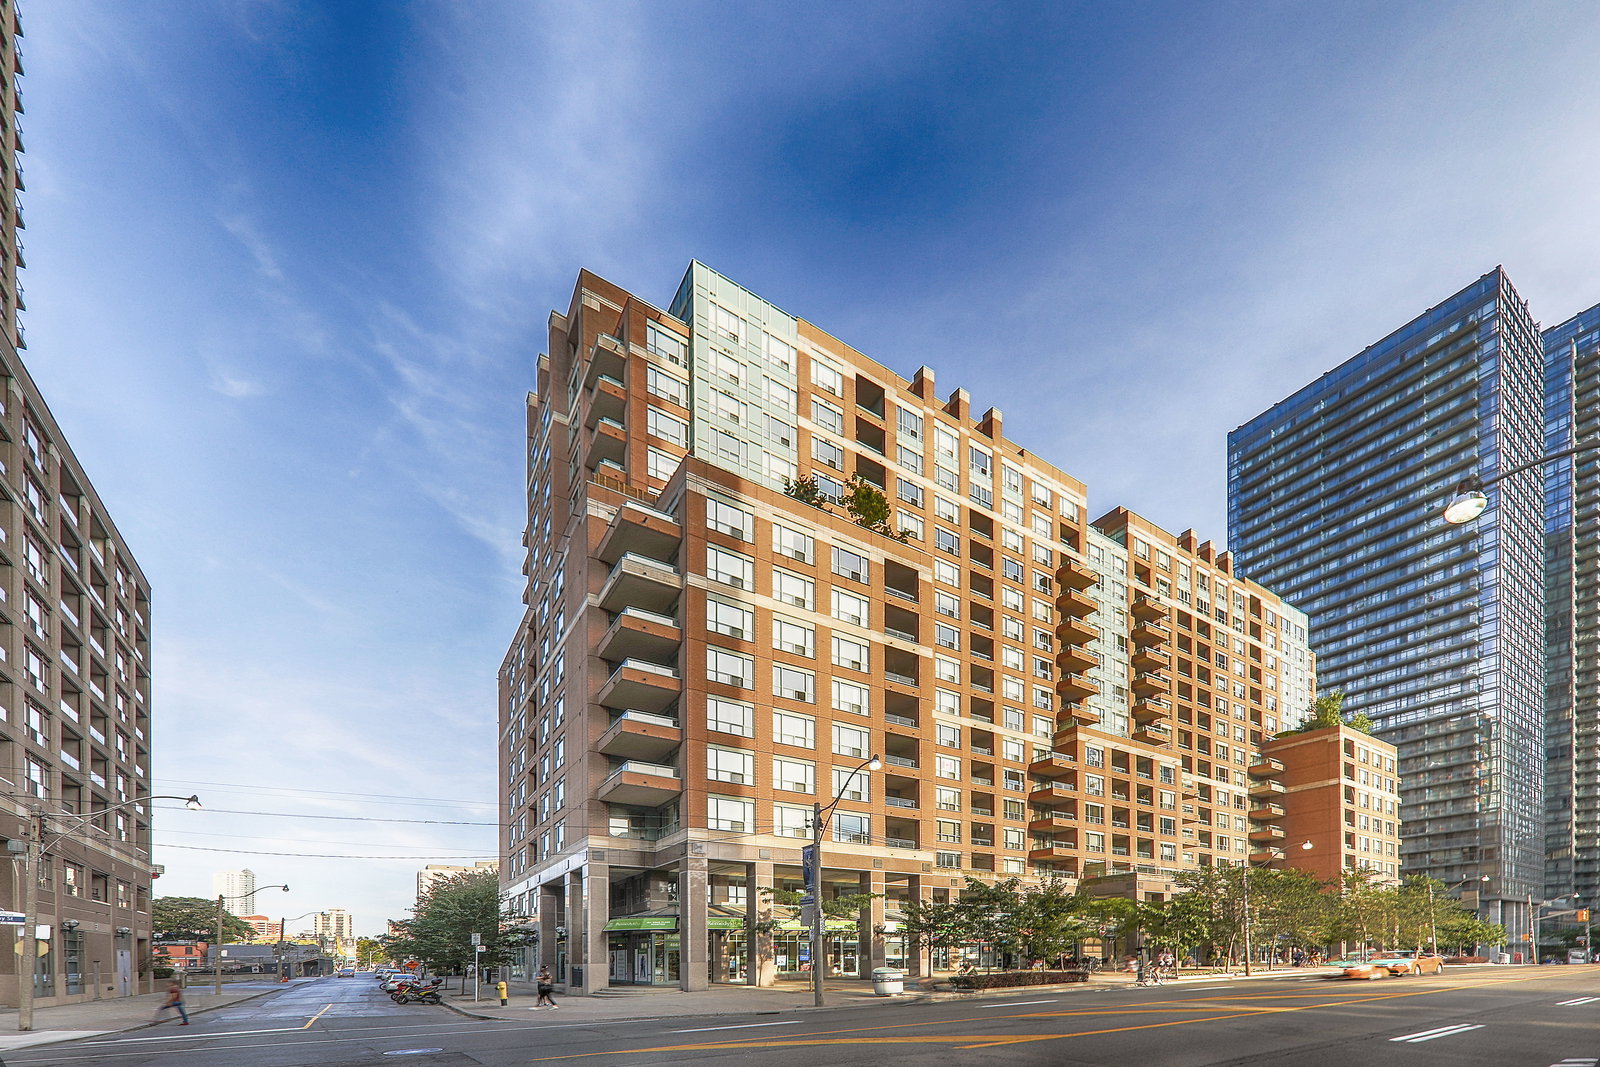
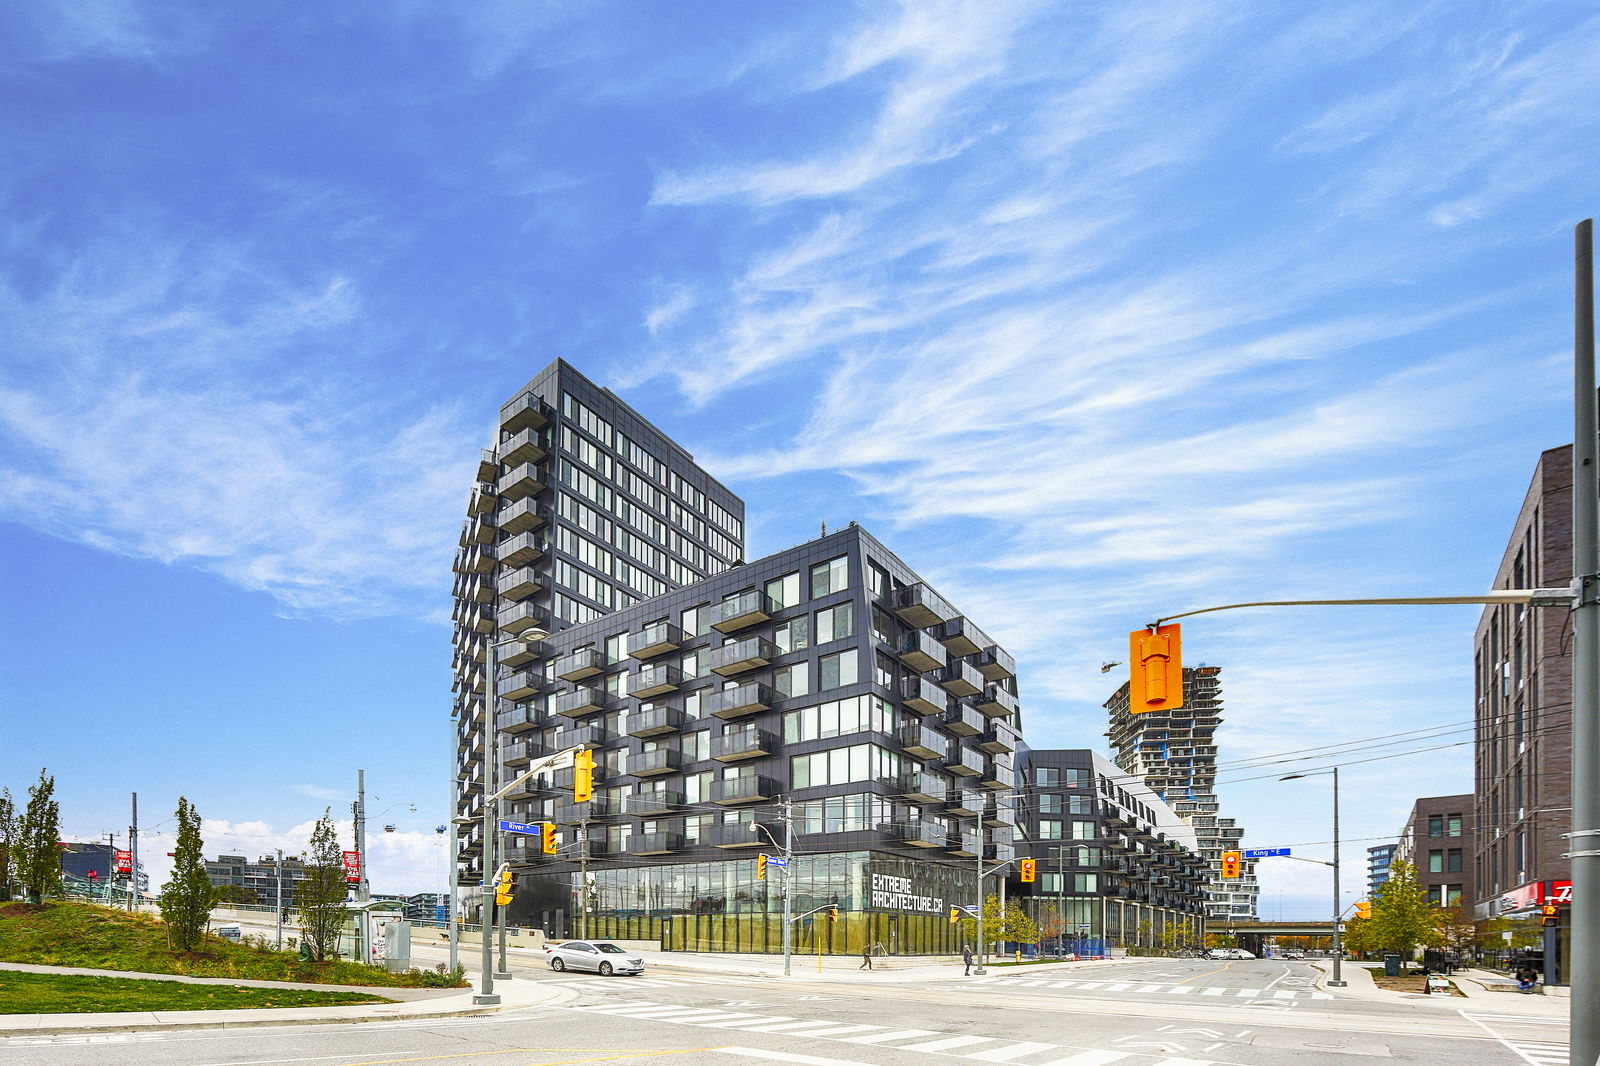
This remarkable housing complex, known as River City Lofts, is the first phase of a three-part project. It's conveniently located at 51 Trolley Crescent and 47 Lower River Street, and was built back in 2013, followed by River City II Lofts and River City Phase 3.
The developer, Urban Capital, wasn’t simply granted free reign over the coveted West Don Lands where this property is located. Rather, the firm competed against a slate of international developers for the opportunity to build River City Condo Lofts.
Even since this victory, Urban Capital hasn’t stopped raking in the awards for this set of condos. The building was named 'Best Design' by the Building Industry and Land Development Association, and is recognized as the first carbon-neutral residential building in Toronto. Efficiency, sustainability, and modern livability are all concepts valued by these developers, and clearly that kind of forward-thinking attitude has paid off.
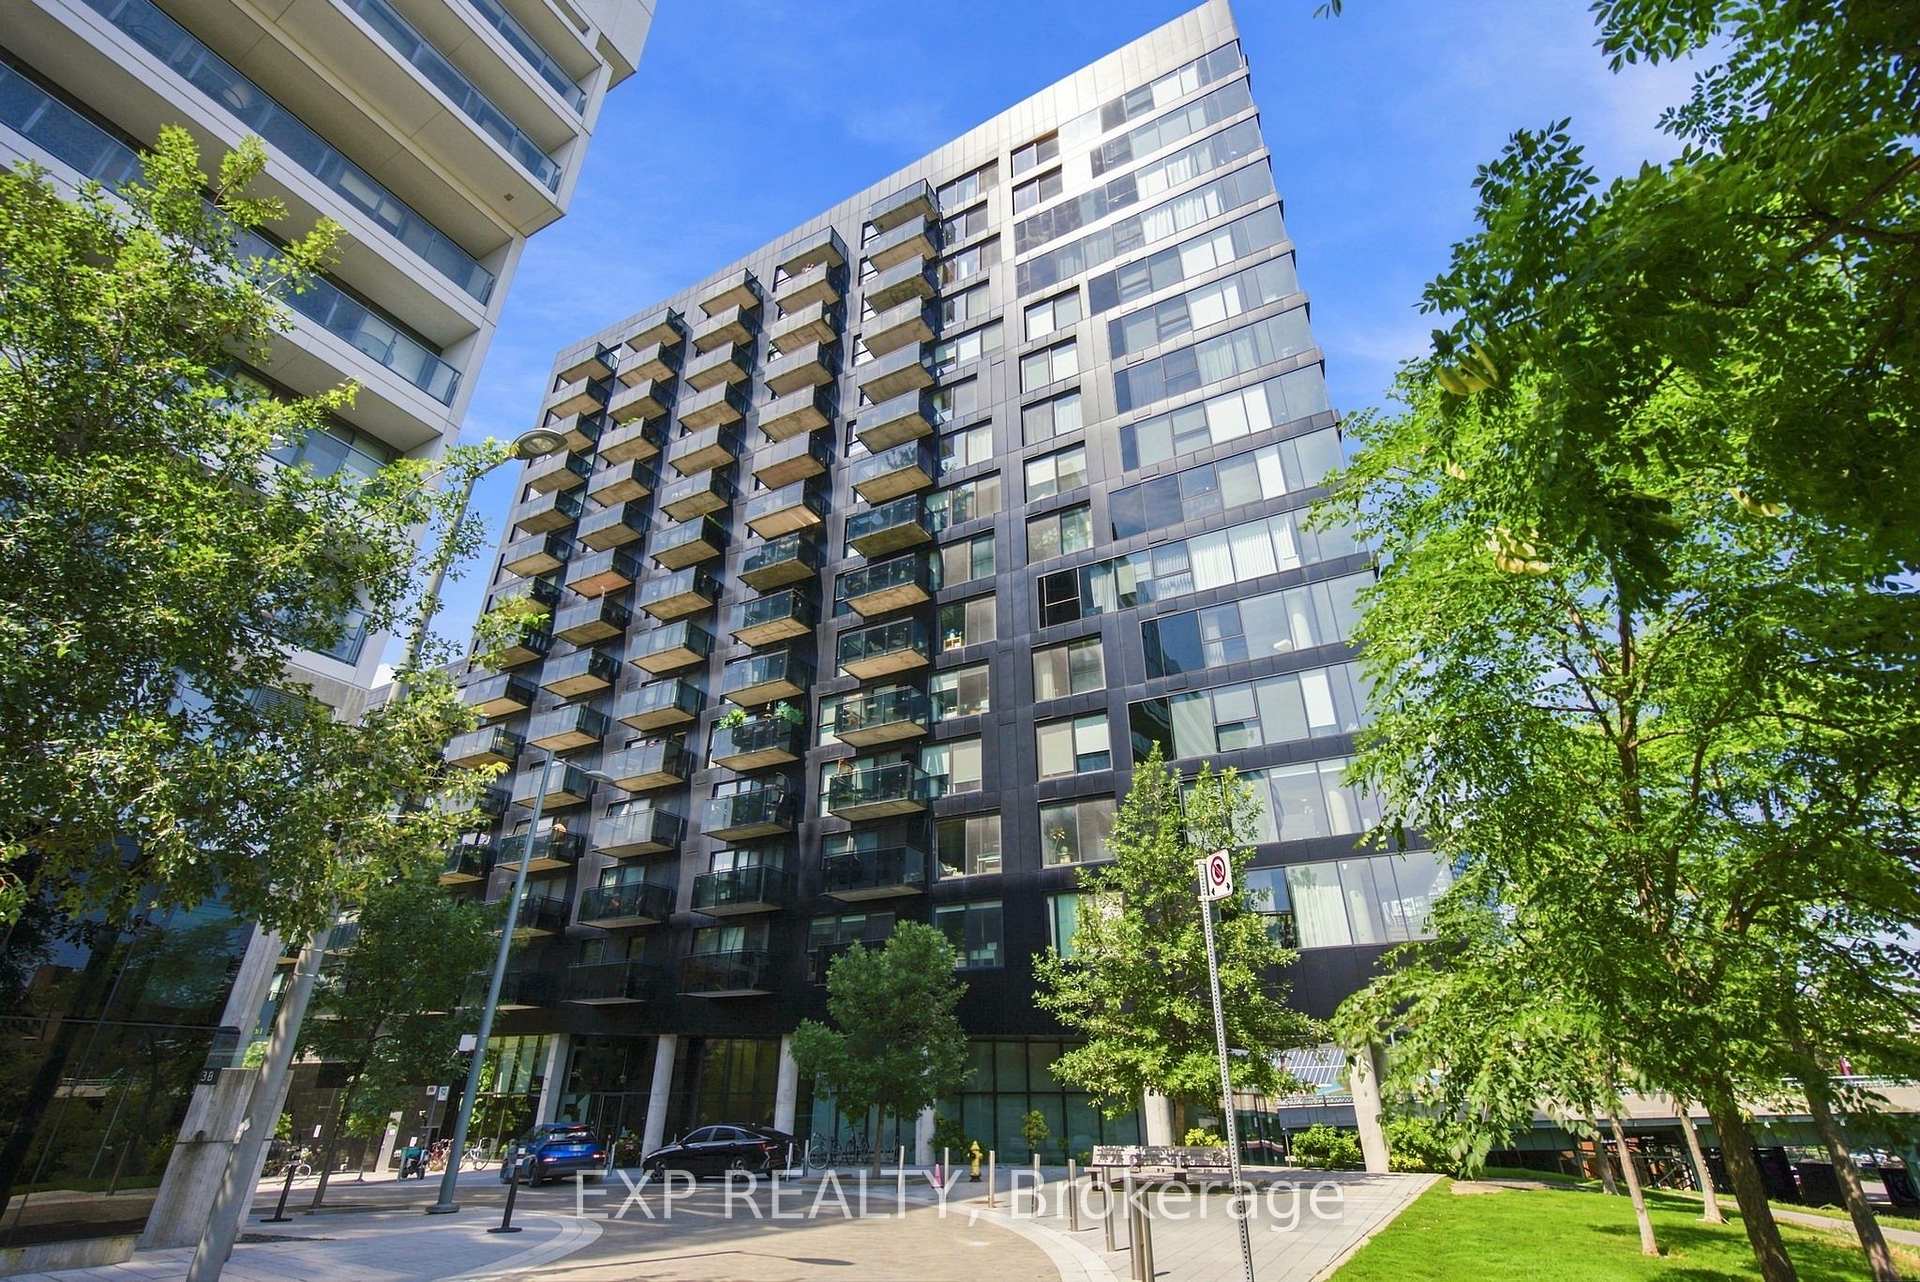
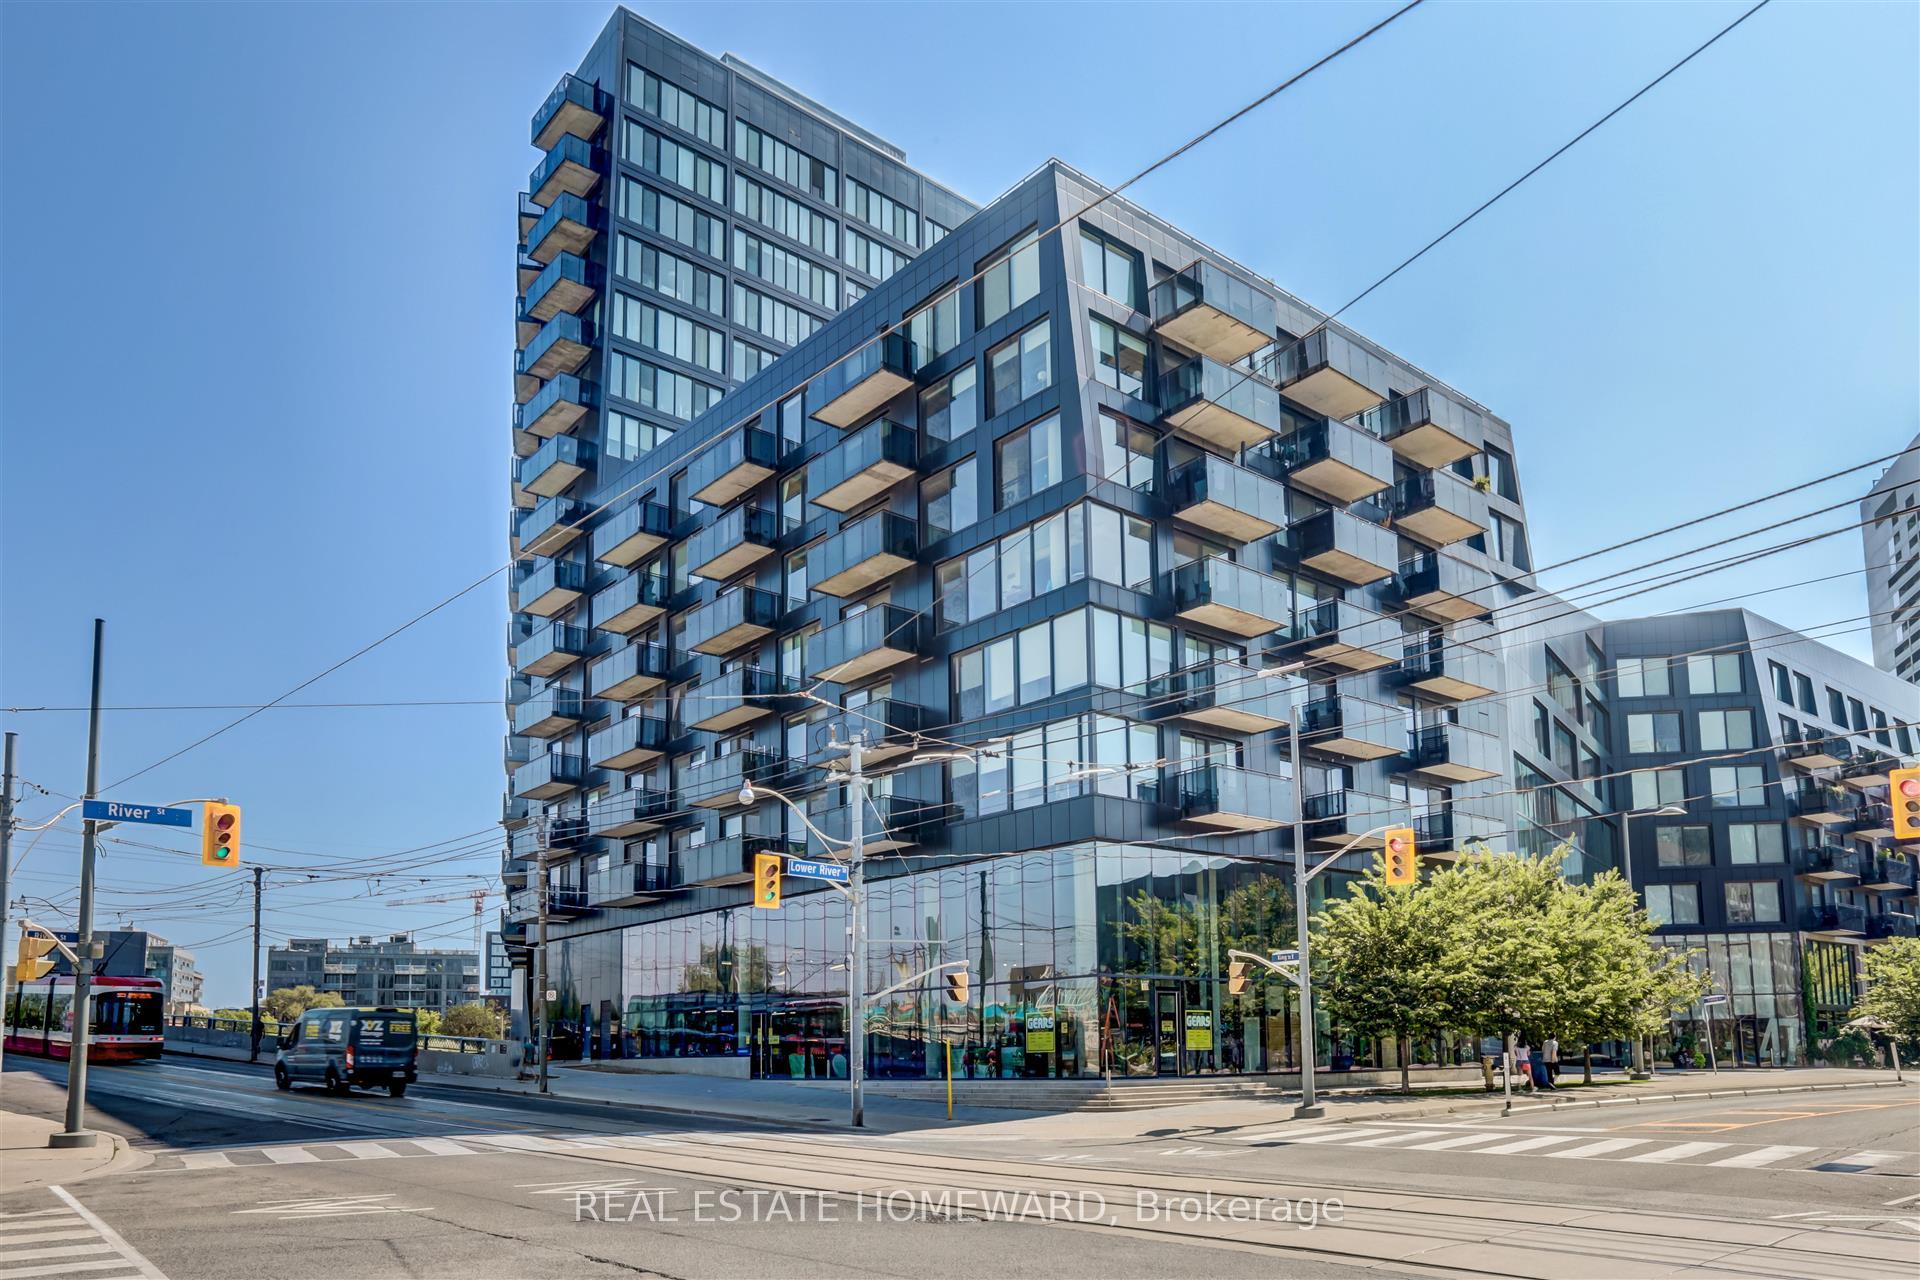
River City I Lofts has a mysterious, yet refined aesthetic, thanks to the dark colours that decorate up its façade. The heavy use of glass also mimics older, industrial buildings that surround 51 Trolley Crescent and 47 Lower River, allowing this contemporary structure to blend in, while simultaneously standing out for its innovative design.
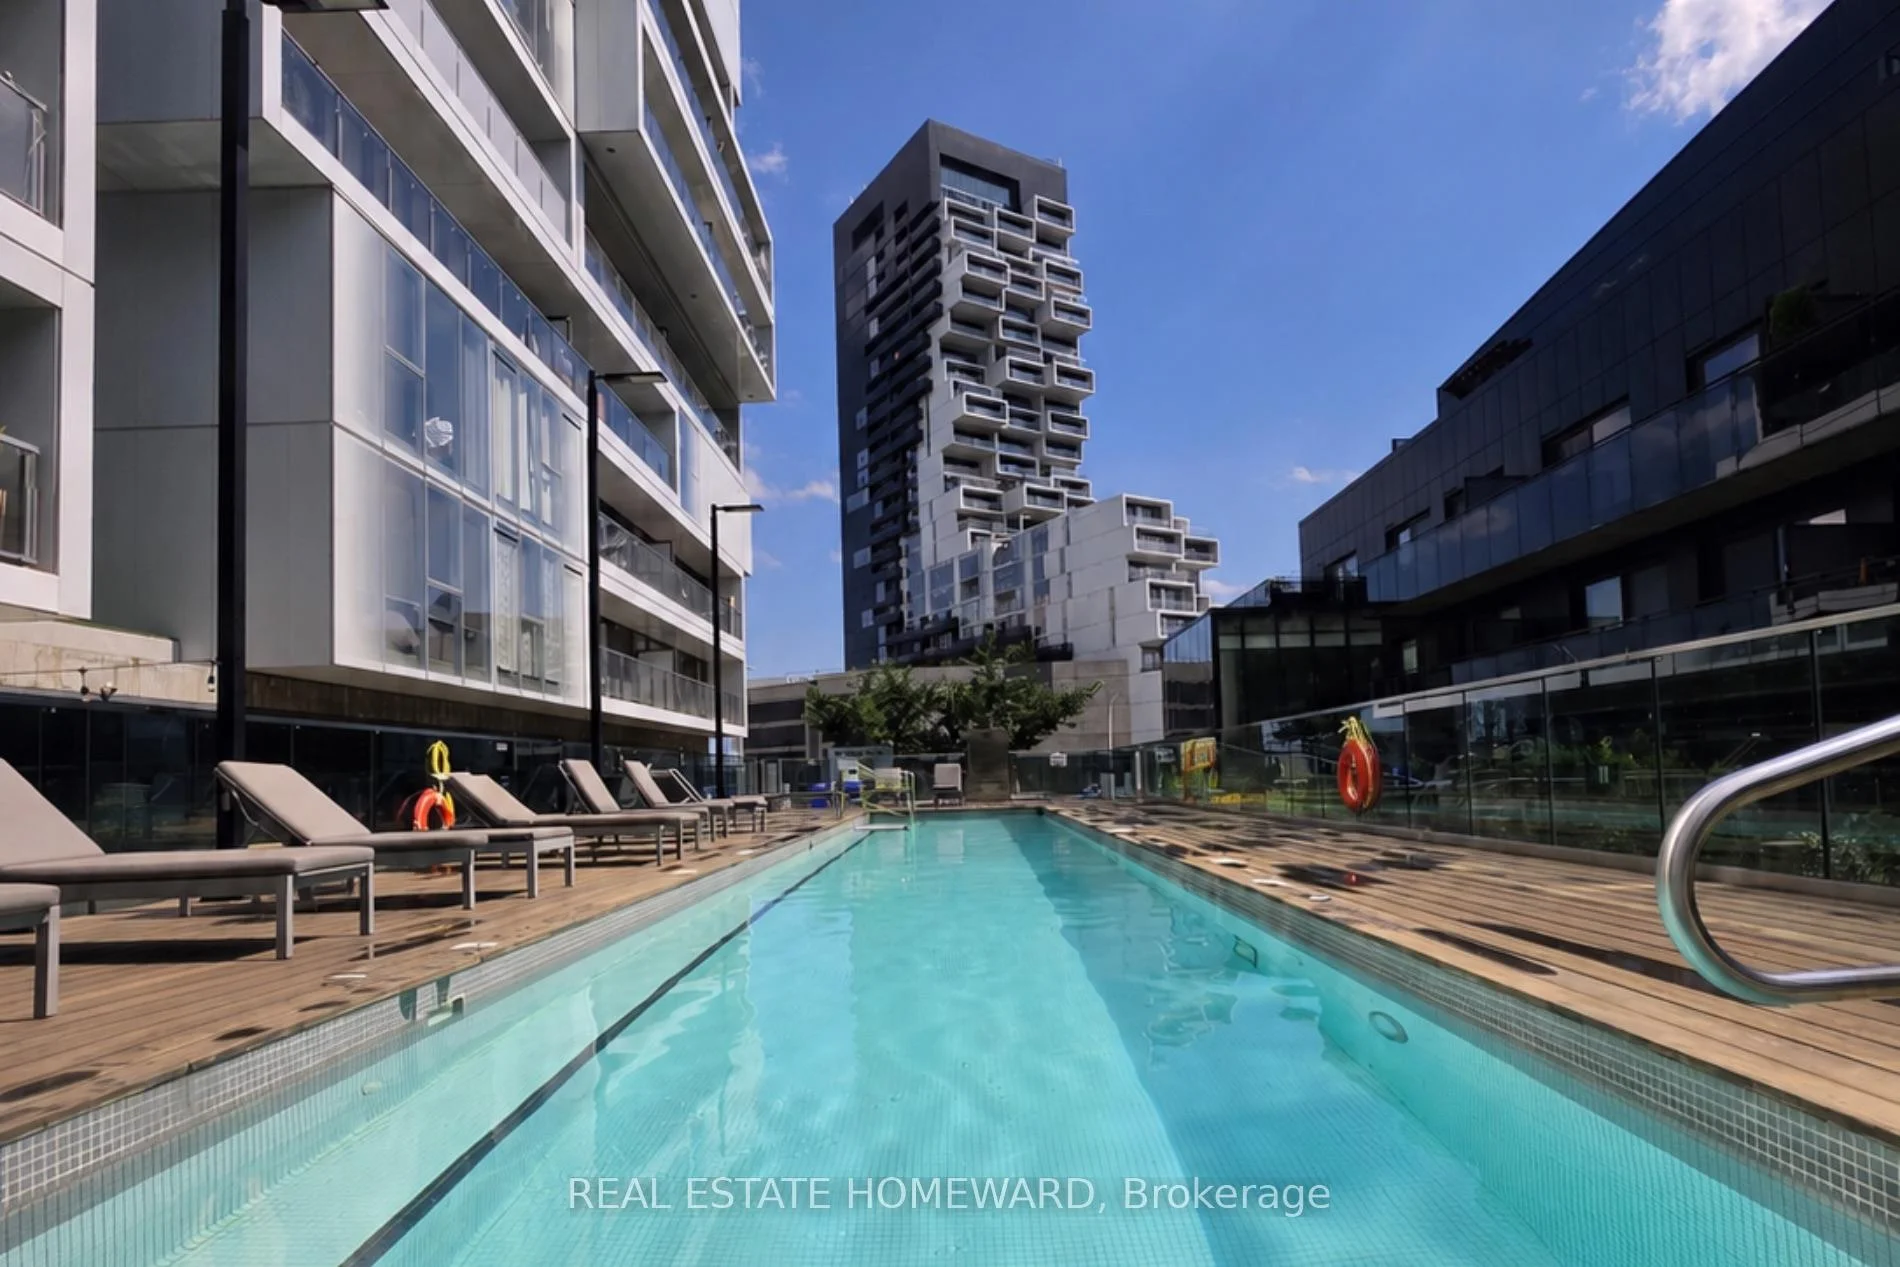
As the address suggests, these lofts are technically comprised of two separate buildings. A connecting tunnel encased in glass leads from one to the other, a number of storeys above ground level. And regardless of which building one opts for, all residents have access to an outdoor swimming pool, a gym, visitor parking, and a media room located within a glass lightbox.
Developer
Urban Capital Property Group
Year Built
2013
Property Type
Mid-Rise Condo
Storeys
16
Total Units
345
Management
Crossbridge Condominium Services Ltd.
Guest Suites
Fitness Centre
Rooftop Garden
Visitor Parking
BBQ Area
Outdoor Pool
Party Room
Bike Storage
24/7 Concierge
$866
Avg $/sqft
-15.6%
YoY change
28
Avg days on market
Walk Score
93/100
Daily errands on foot
Transit Score
99/100
TTC, GO, subway access
Bike Score
73/100
Bike lanes & infrastructure
Neighbourhood in Toronto
Corktown is a neighbourhood in Toronto known for its community feel. It offers various amenities and is a vibrant place to live.
Median asking price
In Ontario
$716,900
Median monthly rent
In Ontario
$2,499
For sale
0
For rent
0
Recently sold
Sign in to see sold data
Recently leased
Sign in to see leased data
Market data as of 2026-08-16. Sold and leased figures are neighbourhood medians over the last 12 months, published only where at least 5 homes closed — never a single sale.
What people love
Keep in mind
Daily life in Corktown includes enjoying local parks and dining. The area is suitable for families and those who enjoy community activities.
Not enough verified data yet. We count schools, parks, transit and shops inside Corktown - Toronto's real boundary and publish the numbers only once that count is confirmed — an estimate here would be worse than nothing.
4,787
Population (2021)
0.8 km²
Area
5,964
People per km²
34.4
Median age
$94,000
Median income
53%
Own their home
1.6
People per household
2,905
Households
Every age
What is built here
Own or rent
53%Owners
47%Renters
Across 2,905 households
When it was built
Mostly 2011–2015
Share of occupied homes, by the era they were built in. Bars are drawn against the busiest era, not against each other, because the eras are not the same length. The eight shares are unlikely to total exactly 100: Statistics Canada rounds each era's count to the nearest 5 before publishing it, so we print what the census reports rather than adjusting a figure to make the column add up.
Statistics Canada, Census of Population 2021. Added up from 1 census area around the listings we hold here. Medians and rates are a population-weighted average of dissemination-area figures.
Sources: HOMEH listings, Statistics Canada, Census of Population 2021, OpenStreetMap, © OpenStreetMap contributors (ODbL)