Year Built
1998
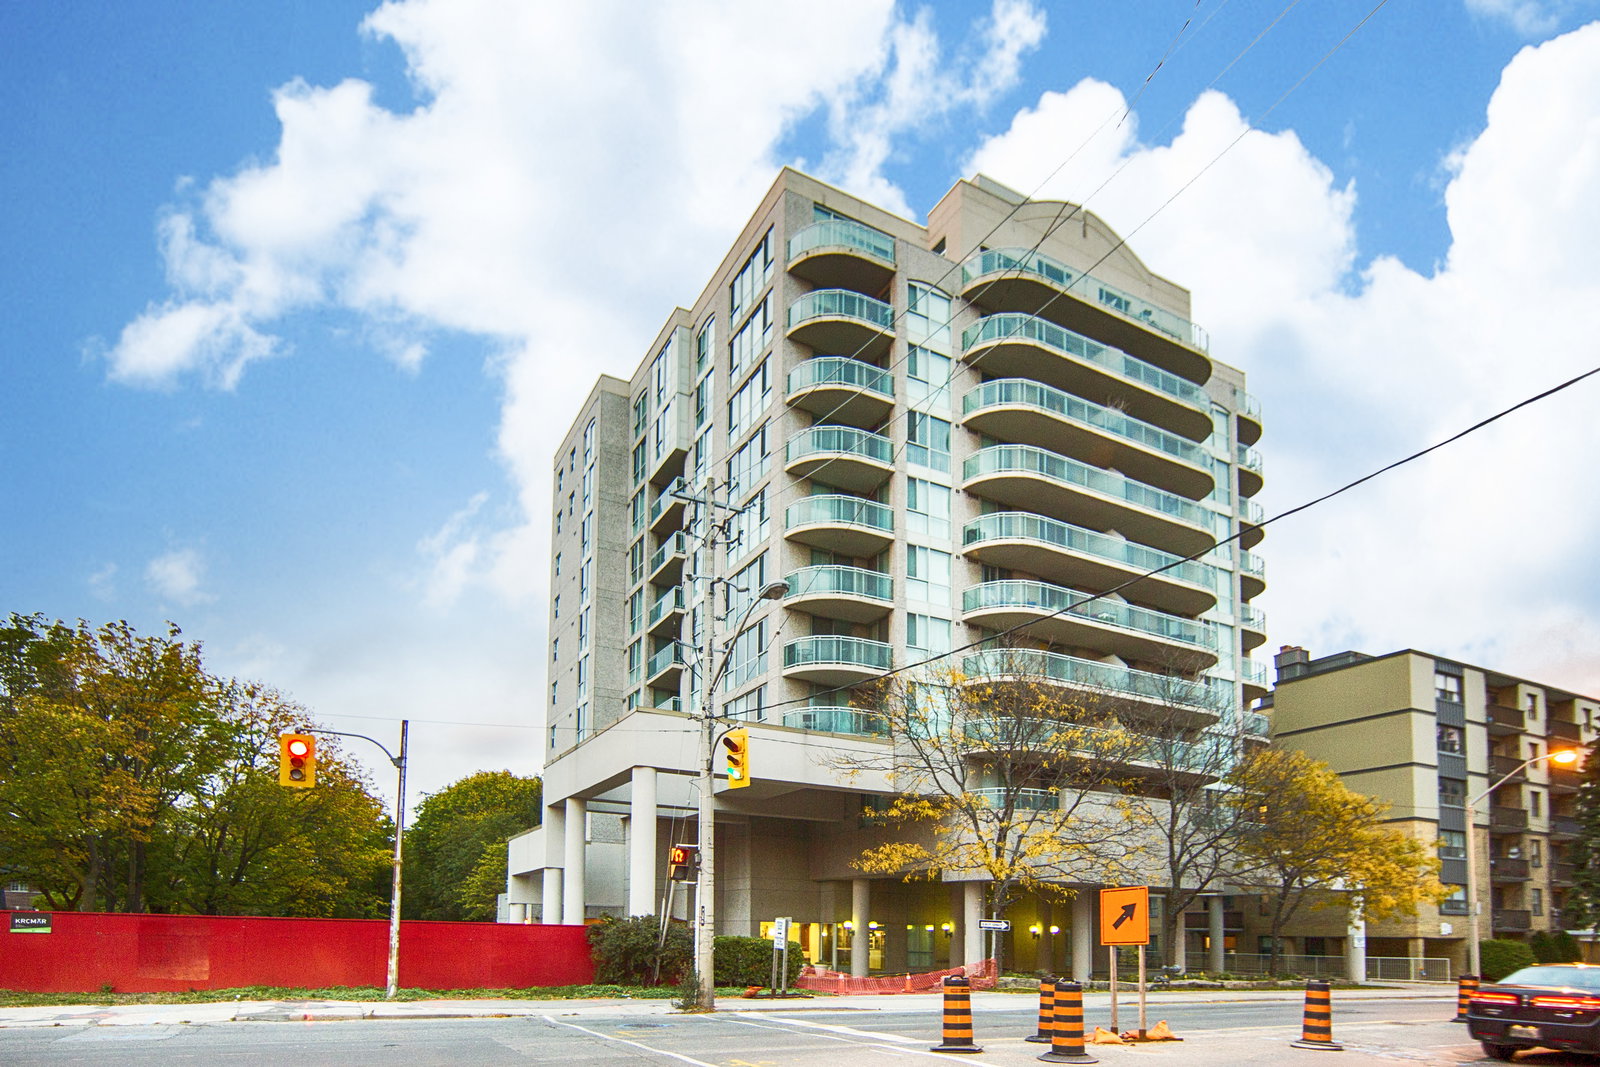
by Dynasty Executive Suites Limited
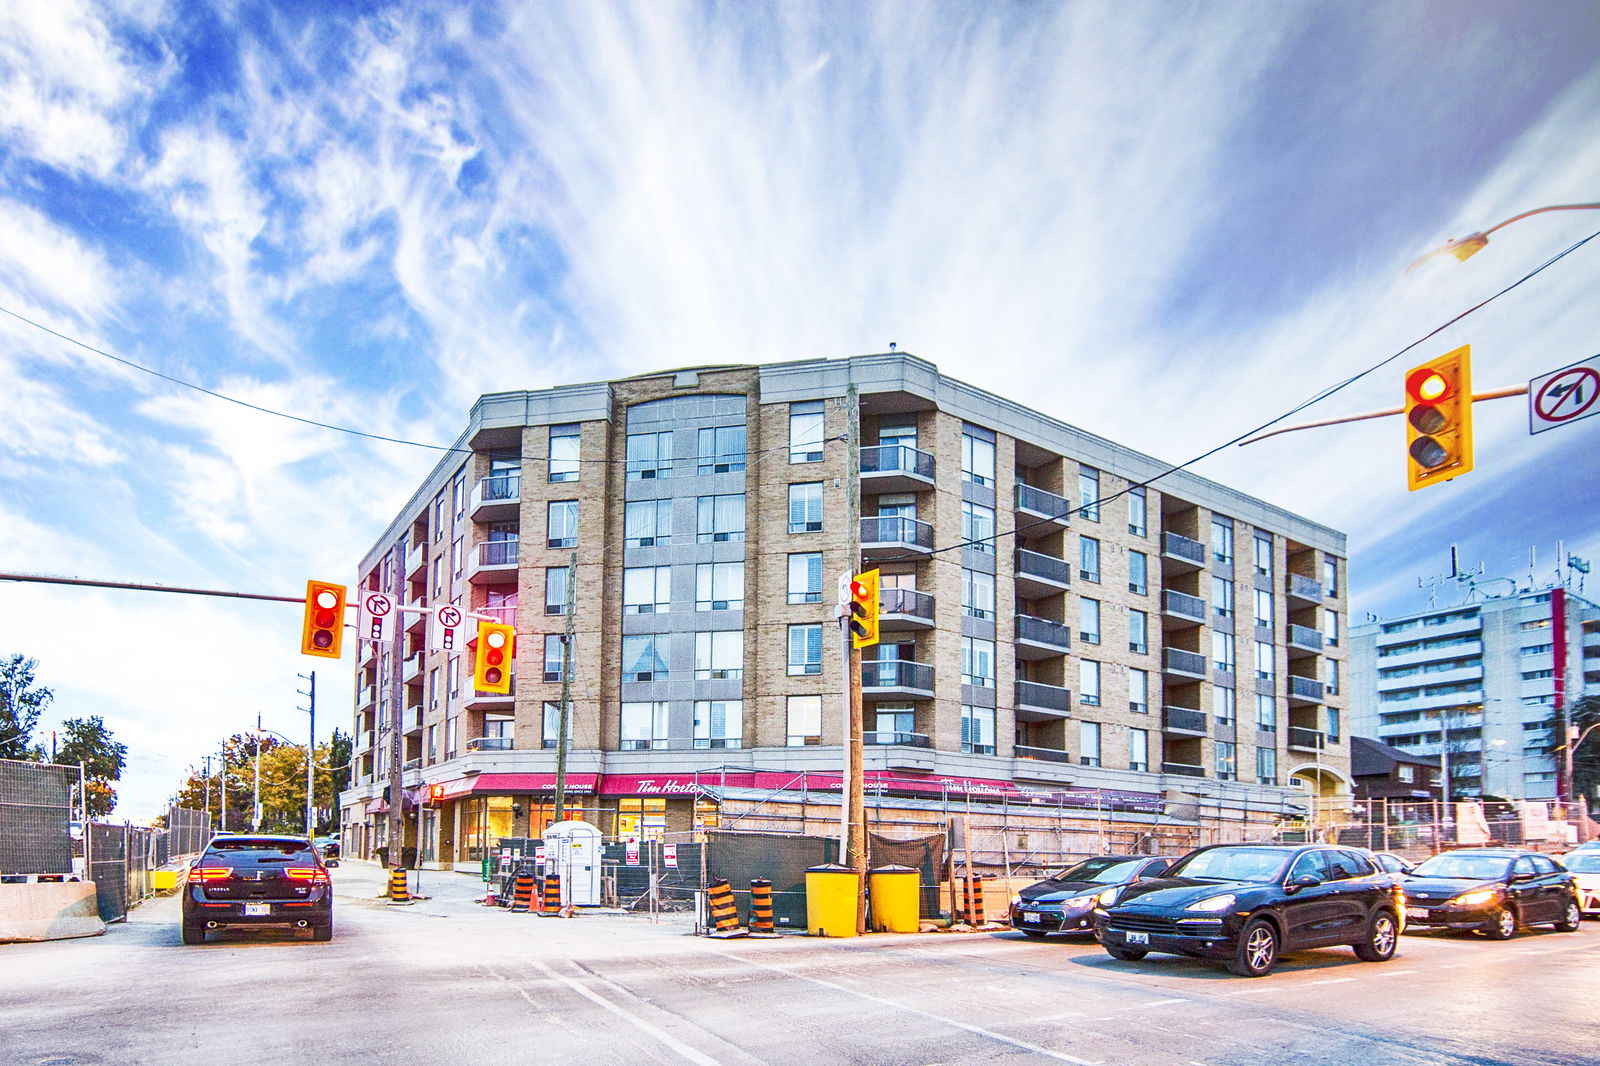
398 Eglinton Avenue E, Toronto, ON M4P 3H8
Year Built
1998
Total Units
88
Avg $/sqft
$789
Storeys
10
0
Units for sale
0
Units for rent
Live MLS · Updated daily
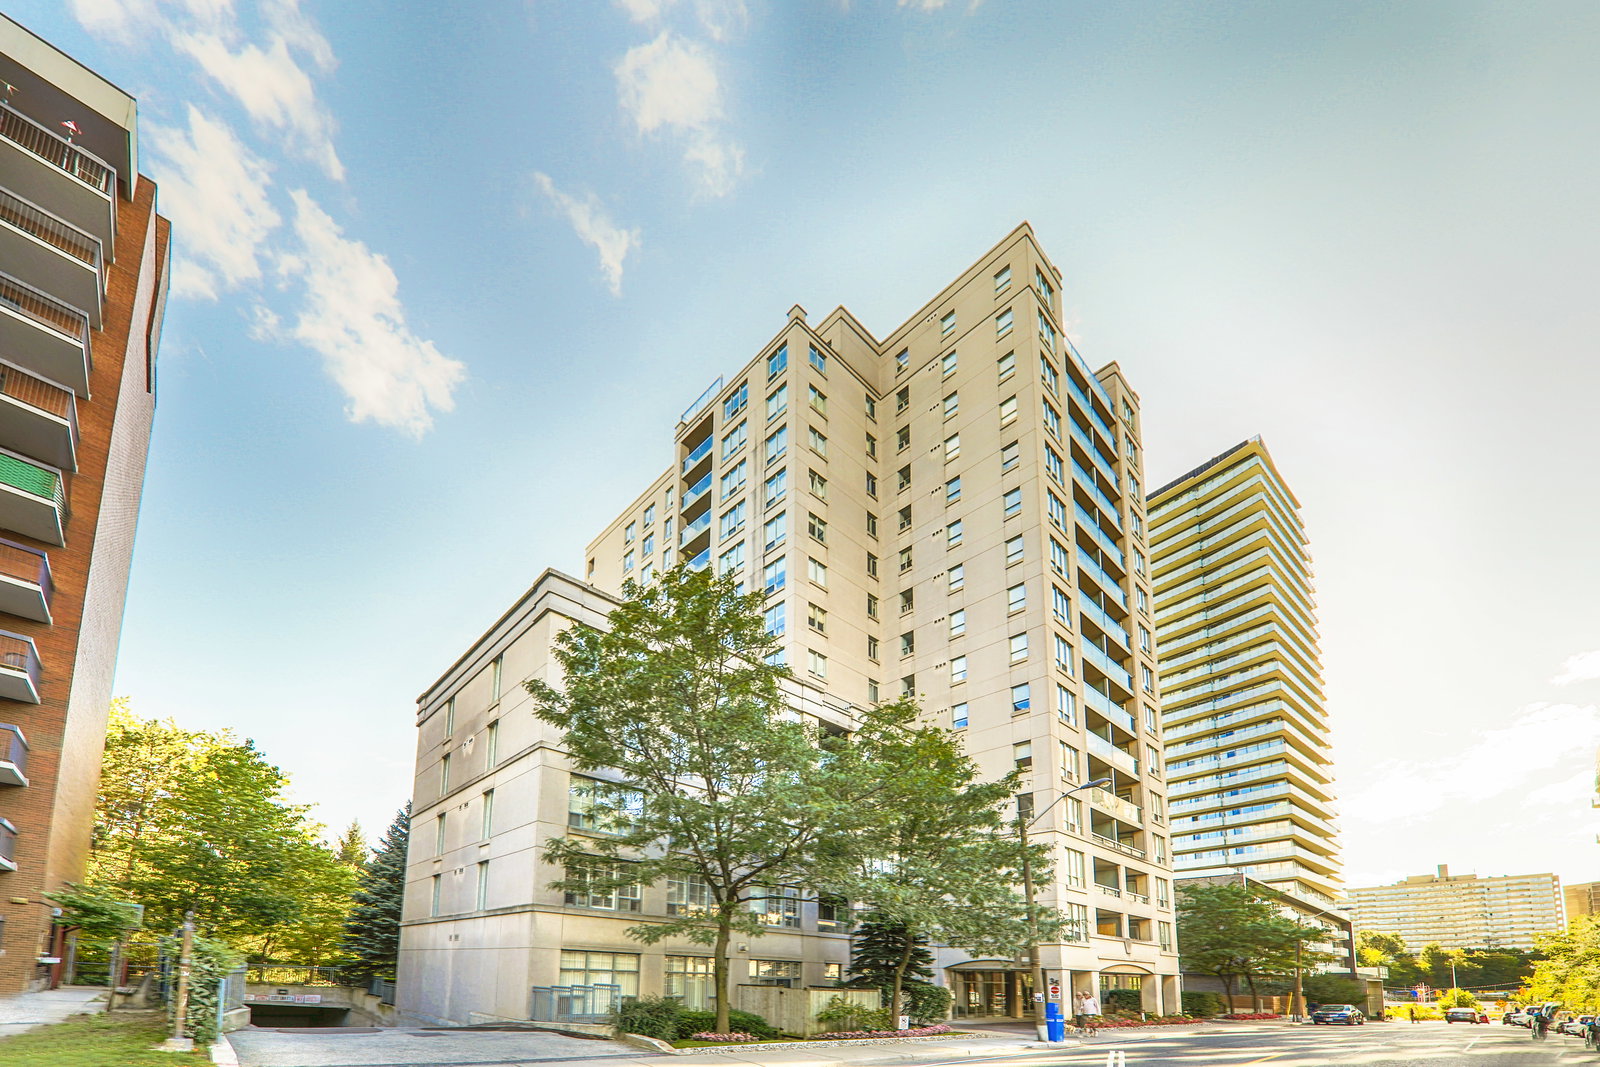
A fixture of the diverse Mount Pleasant neighbourhood, the stylish condos at 398 Eglinton Avenue East have long attracted many prospective homeowners. Developed by Dynasty Executive Suites Limited, the landmark Maxim Condos seem to even testify to this midtown Toronto community’s vibrancy.
The building at 398 Eglinton East does so even when standing at just at 10 storeys tall. The modern architecture of this modestly size building features blue glass balconies and windows that seem to shine even on the cloudiest days. Although the columns at the Maxim Condos’ entrance may make less of an impression as they did when the building was completed in 1998, this is only because the trees in front have grown quite grand themselves.
Inside, 398 Eglinton East offers a remarkable collection of amenities for residents to enjoy. This includes fitness facilities that are fully-equipped and connected to change rooms and saunas, a party room with its own kitchen, and even a welcoming garden containing a gazebo and common barbecues. Finally, the elegantly appointed lobby is equipped with a 24-hour concierge, whose service matches the warmth set forth by the lush landscaping along Eglinton East.
Developer
Dynasty Executive Suites Limited
Year Built
1998
Property Type
Mid-Rise Condo
Storeys
10
Total Units
88
Management
360 Community Management Ltd.
Underground Parking
Security System
Fitness Centre
Sauna
Visitor Parking
Party Room
Bike Storage
$789
Avg $/sqft
-6.2%
YoY change
7
Avg days on market
Walk Score
87/100
Daily errands on foot
Transit Score
82/100
TTC, GO, subway access
Bike Score
54/100
Bike lanes & infrastructure
Neighbourhood in Toronto
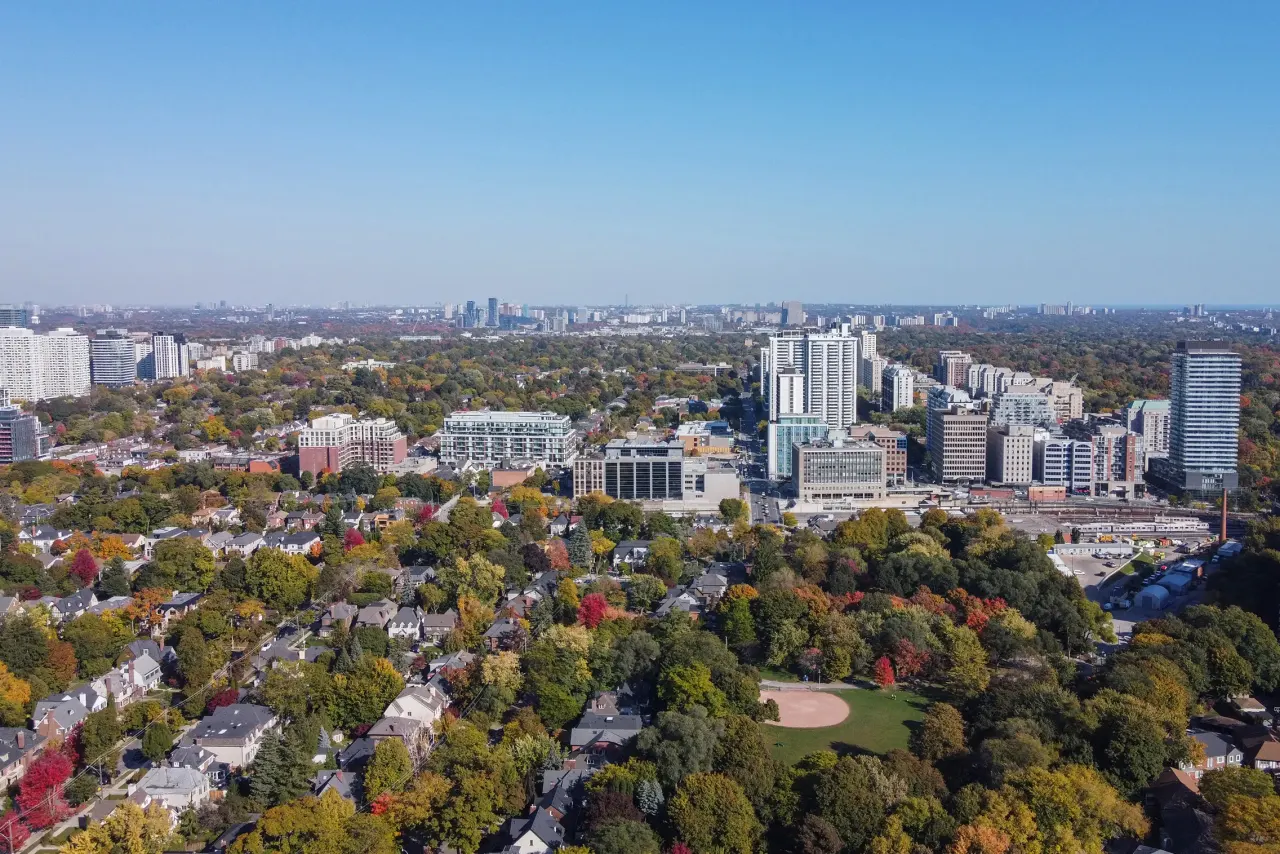
Mount Pleasant East is a vibrant neighbourhood in Toronto known for its walkability and access to amenities. It offers a mix of parks, schools, and dining options, making it a desirable place to live.
Toronto, Ontario
© Wikimedia Commons contributors (CC BY-SA)
Median asking price
In Ontario
$716,900
Median monthly rent
In Ontario
$2,499
For sale
0
For rent
0
Recently sold
Sign in to see sold data
Recently leased
Sign in to see leased data
Market data as of 2026-08-16. Sold and leased figures are neighbourhood medians over the last 12 months, published only where at least 5 homes closed — never a single sale.
What people love
Keep in mind
Daily life in Mount Pleasant East is active and community-focused, with plenty of options for shopping and recreation.
The boundary
3.1 km²
Every count and every census figure on this page was measured inside this line — not within a circle drawn around a centre point.
8
Parks
7
Playgrounds
4
Transit stations
7
Grocery stores
45
Restaurants
7
Cafés
7
Gyms
2
Libraries
3
Pharmacies
Counted across all 3.1 km² of Mount Pleasant East. From OpenStreetMap, as of 2026-10-12.
8.2/10
Average rating of the 1 rated school in this area
7
Elementary
4
Secondary
Northern Secondary School
Public · Grades 9–12 · Toronto DSB
65th of 742 Ontario secondary schools
2,075 students · EQAO 2024-2025
Greenwood College School
Independent
Not rated
Hodgson Middle School
Public · Grades 6–8 · Toronto DSB
Not rated
580 students · EQAO 2024-2025
Jerome D Diamond Adolescent Centre - EL
Public · Grades 1–8 · Toronto DSB
Not rated
Jerome D Diamond Adolescent Centre - SEC
Public · Grades 9–12 · Toronto DSB
Not rated
Manor Montessori School
Independent
Not rated
Ontario Ministry of Education school registry; ratings from the Fraser Institute report card. These are the schools that stand inside Mount Pleasant East, not a catchment — most Ontario boards do not publish attendance boundaries, and we will not draw a line we cannot source. Confirm enrolment with the school board before you buy.
16,373
Population (2021)
3.1 km²
Area
5,275
People per km²
42.4
Median age
$132,075
Median income
55%
Own their home
2.4
People per household
7,150
Households
Every age
What is built here
Own or rent
55%Owners
45%Renters
Across 7,150 households
When it was built
Mostly 1960 or earlier
Share of occupied homes, by the era they were built in. Bars are drawn against the busiest era, not against each other, because the eras are not the same length. The eight shares are unlikely to total exactly 100: Statistics Canada rounds each era's count to the nearest 5 before publishing it, so we print what the census reports rather than adjusting a figure to make the column add up.
Statistics Canada, Census of Population 2021. Added up from 25 census areas inside the boundary. Medians and rates are a population-weighted average of dissemination-area figures.
Sources: HOMEH listings, Statistics Canada, Census of Population 2021, OpenStreetMap, HOMEH school registry, Photo: © Wikimedia Commons contributors (CC BY-SA)