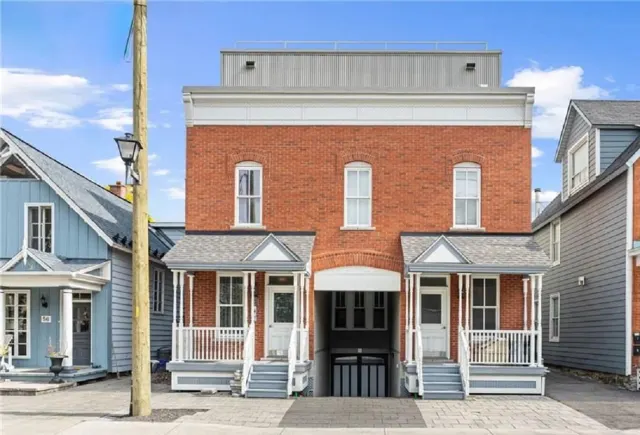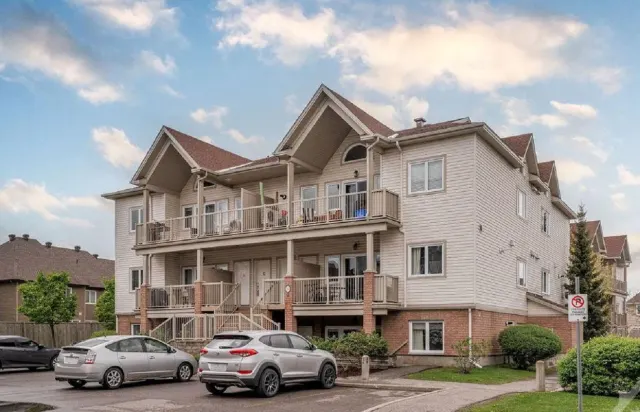

Registered
2005
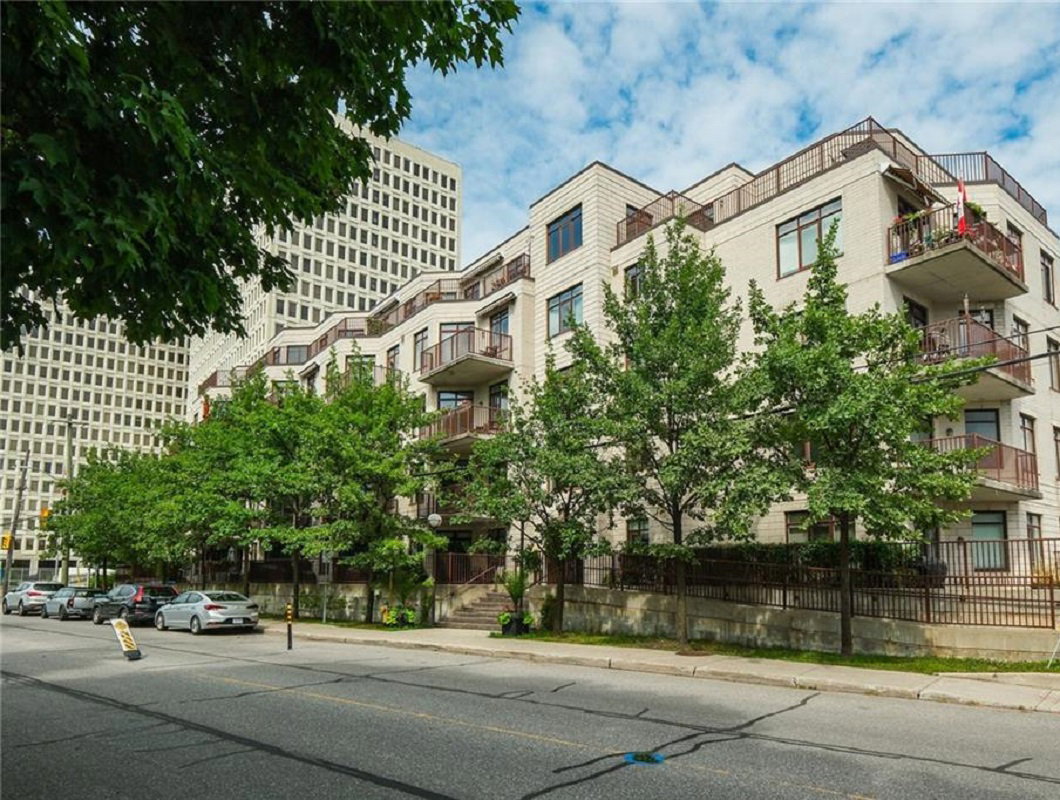
by Lépine
369 North River Rd, Ottawa, ON K1L 8C2
Registered
2005
Total units
36
Storeys
5
0
Units for sale
0
Units for rent
Live MLS · Updated daily
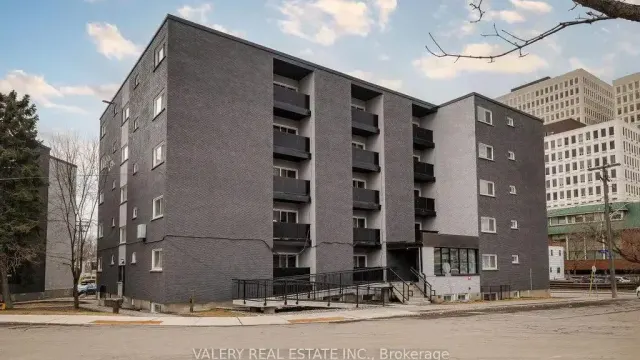
Les Terrasses Amelie is a 5-storey condo building with 36 units at 369 North River Rd in Ottawa. It was developed by Lépine and registered as a condominium in 2005. Maintenance fees run $0.64 per sq ft a month (2022), 7% lower than the Ottawa average of $0.69.
Developer
Lépine
Registered
2005
Property type
Low-Rise Condo
Storeys
5
Total units
36
Maintenance fees
$0.64/sq ft
A month, 2022
Below-average fees7% lower than the Ottawa average of $0.69/sq ft
Visitor Parking
BBQ Area
$0.64
per sq ft a month, 2022
Up 23.1% from $0.52 in 2018
—
Avg $/sqft
—
YoY change
—
Days to sell
In 2022, maintenance fees at Les Terrasses Amelie averaged about $0.64 per square foot per month. The fee includes water and heat.
Les Terrasses Amelie was registered as a condominium in 2005.
Les Terrasses Amelie has 36 units across 5 storeys.
Les Terrasses Amelie was developed by Lépine.
City in Ontario
Ottawa is the capital city of Canada, located in Ontario. It offers a mix of urban and suburban living with many amenities.
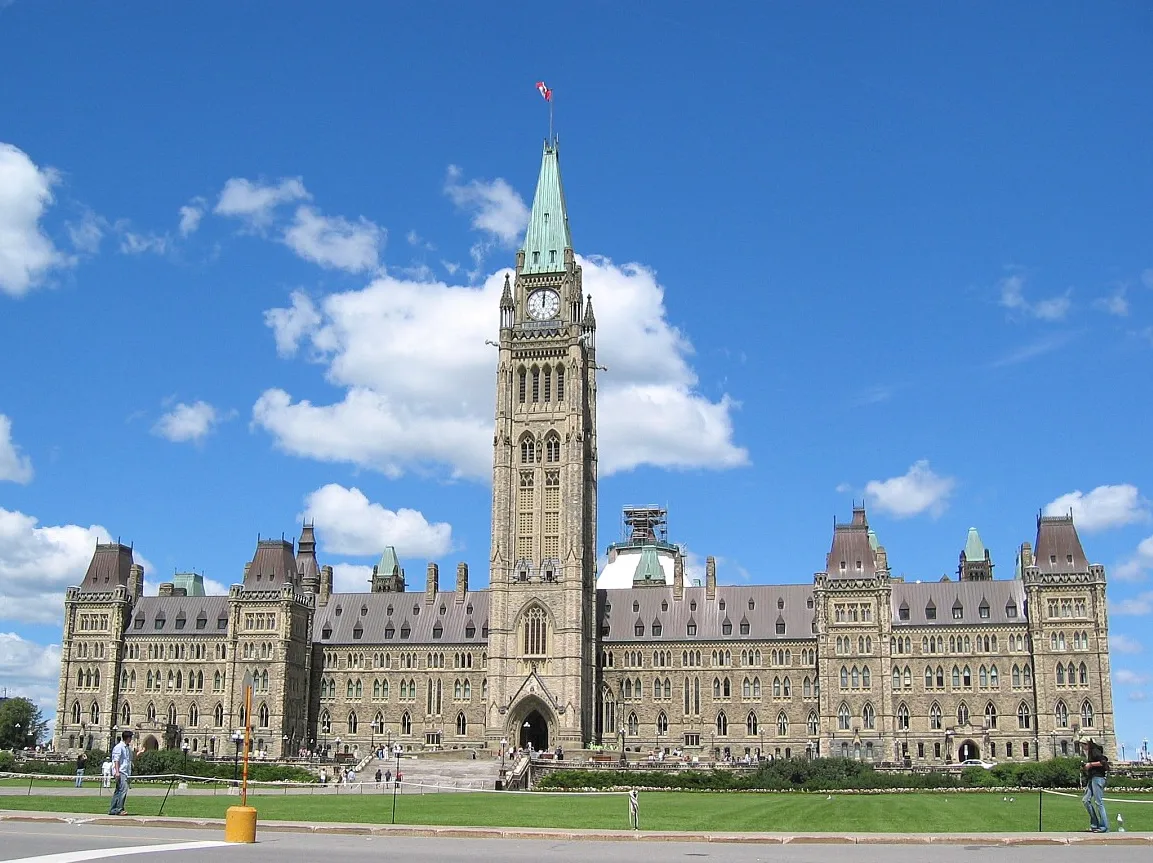
Ottawa, Ontario
© Wikimedia Commons contributors (CC BY-SA)
96
Walkability
out of 100 · averaged over 60 past and present listings
Average walk score reported on listings here
6.5
Schools near listings
out of 10 · averaged over 57,467 past and present listings
Fraser Institute ratings within 2 km of each listing, closer schools weighted more
Each score is an average over this area's own listings and is shown only where at least 5 of them carry one. Scores are reported by listing agents, not measured by HOMEH.
Median asking price
$639,900
In Ottawa
$639,900
In Ontario
$699,900
Median monthly rent
$2,475/mo
In Ottawa
$2,475
In Ontario
$2,495
$546
Per square foot
≈ 21.5 years
Of rent to match the purchase price
For sale
3,645
Median $639,900
Houses 2,484 · Condos 1,161
For rent
1,467
Median $2,475
Recently sold
Sign in to see sold data
Recently leased
Sign in to see leased data
Market data as of 2026-11-19. Sold and leased figures are neighbourhood medians over the last 12 months, published only where at least 5 homes closed — never a single sale.
What people love
Keep in mind
Daily life in Ottawa is active and community-oriented, with plenty of options for outdoor activities and cultural events.
The boundary
2,864.4 km²
Every count and every census figure on this page was measured inside this line — not within a circle drawn around a centre point.
1,210
Parks
2,224
Playgrounds
61
Transit stations
144
Grocery stores
1,022
Restaurants
455
Cafés
356
Gyms
46
Libraries
284
Pharmacies
Counted across all 2,864.4 km² of Ottawa. From OpenStreetMap, as of 2026-11-16.
6.4/10
Average rating of the 261 rated schools in this area
367
Elementary
117
Secondary
St. Isabel Catholic Elementary School
Public · Grades JK–6 · Ottawa CDSB
25th of 3,045 Ontario elementary schools
325 students · EQAO 2024-2025
Stephen Leacock Public School
Public · Grades JK–6 · Ottawa-Carleton DSB
25th of 3,045 Ontario elementary schools
500 students · EQAO 2024-2025
W. Erskine Johnston Public School
Public · Grades JK–6 · Ottawa-Carleton DSB
42nd of 3,045 Ontario elementary schools
745 students · EQAO 2024-2025
St. Gabriel Elementary School
Independent · Grades JK–6 · Ottawa CDSB
53rd of 3,045 Ontario elementary schools
195 students · EQAO 2024-2025
St Anne Elementary School
Independent · Grades JK–6 · Ottawa CDSB
77th of 3,045 Ontario elementary schools
595 students · EQAO 2024-2025
Hopewell Avenue Public School
Public · Grades JK–8 · Ottawa-Carleton DSB
91st of 3,045 Ontario elementary schools
740 students · EQAO 2024-2025
Ontario Ministry of Education school registry; ratings from the Fraser Institute report card. These are the schools that stand inside Ottawa, not a catchment — most Ontario boards do not publish attendance boundaries, and we will not draw a line we cannot source. Confirm enrolment with the school board before you buy.
1,017,449
Population (2021)
2,788.2 km²
Area
365
People per km²
41.3
Median age
$113,190
Median income
64%
Own their home
2.6
People per household
407,130
Households
Every age
What is built here
Own or rent
64%Owners
36%Renters
Across 407,130 households
When it was built
Mostly 1961–1980
Share of occupied homes, by the era they were built in. Bars are drawn against the busiest era, not against each other, because the eras are not the same length. The eight shares are unlikely to total exactly 100: Statistics Canada rounds each era's count to the nearest 5 before publishing it, so we print what the census reports rather than adjusting a figure to make the column add up.
Statistics Canada, Census of Population 2021. Added up from 1,392 census areas inside the boundary. Medians and rates are a population-weighted average of dissemination-area figures.
Sources: HOMEH listings, Statistics Canada, Census of Population 2021, OpenStreetMap, Photo: © Wikimedia Commons contributors (CC BY-SA)