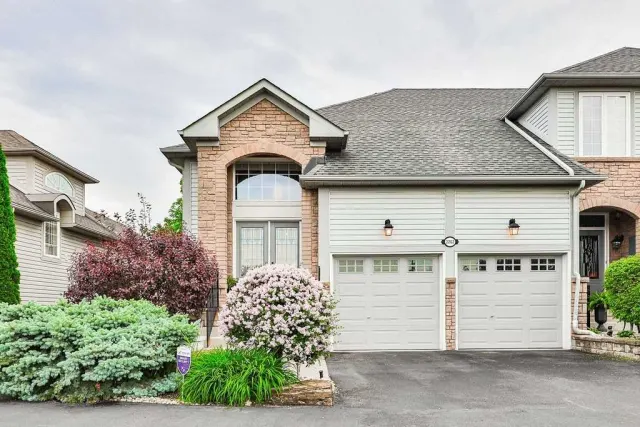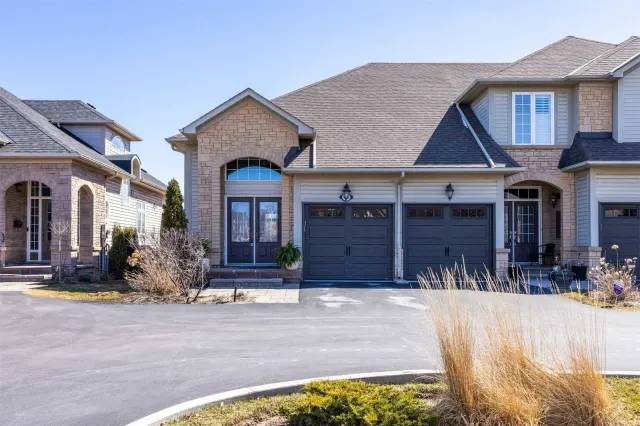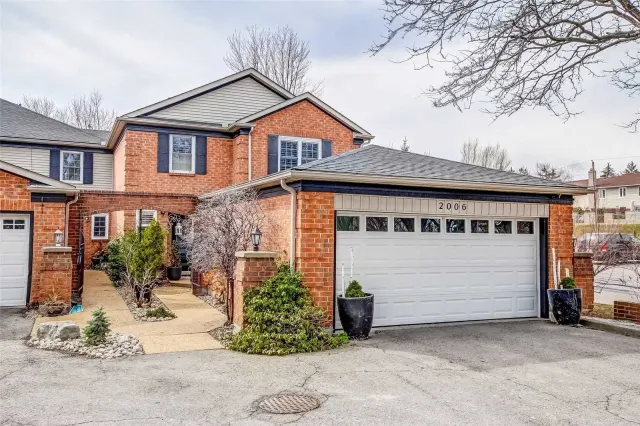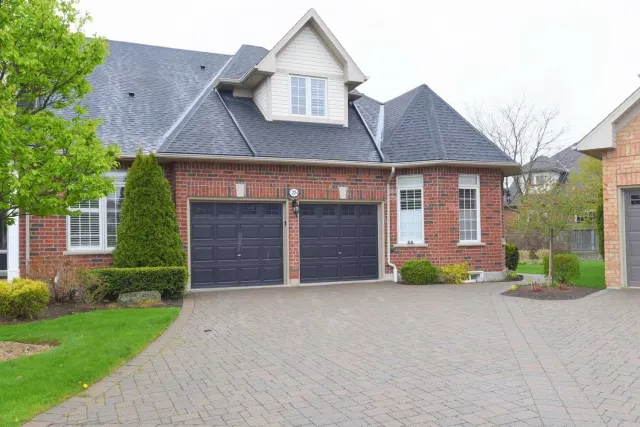

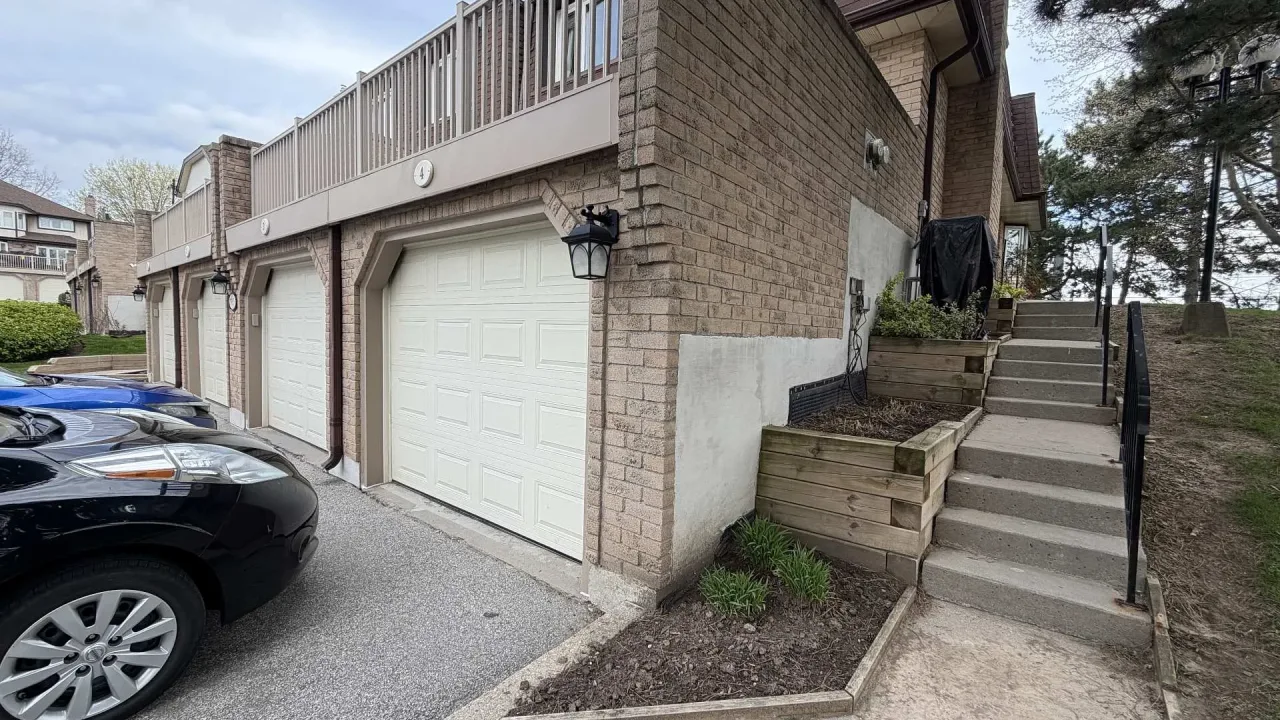
1510 Upper Middle Road
1510 Upper Middle Road, Burlington, ON L7P4M5
Available Units in 1510 Upper Middle Road
0
Units for rent
Live MLS · Updated daily
Overview
1510 Upper Middle Road is a condo building in Tyandaga, Burlington.
Property type
Condo
Suites & Floor Plans
2 bedrooms
1 home on record
Price History
3 recordsMarket Stats
—
Avg $/sqft
—
YoY change
—
Days to sell
Common Questions
How many units are for sale or rent at 1510 Upper Middle Road?
Right now 1510 Upper Middle Road has 1 unit for sale and 0 for rent on HOMEH.
Location & Walkability
Next door to 1510 Upper Middle Road
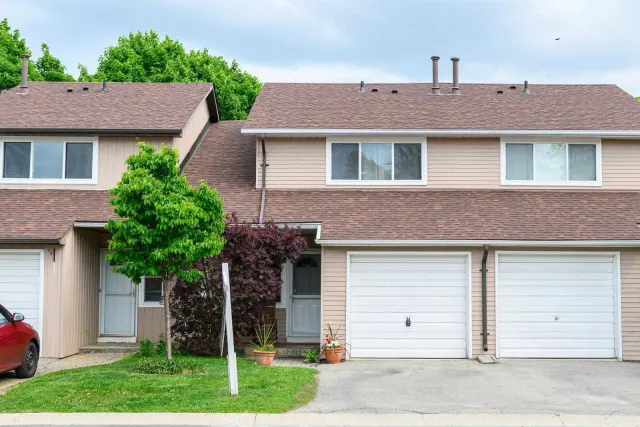
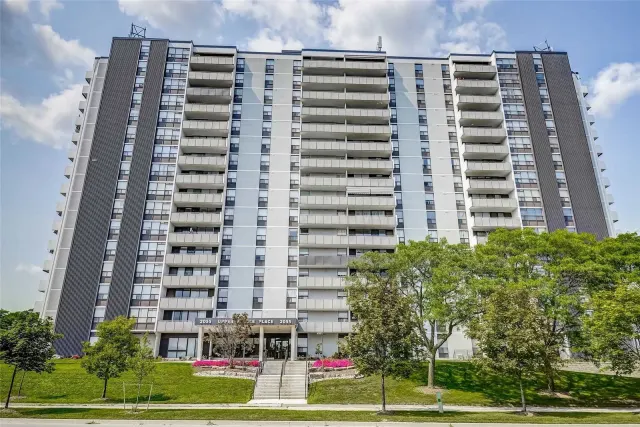
Neighbourhood in Burlington
Tyandaga
Tyandaga is a peaceful neighbourhood in Burlington, Ontario. It offers a mix of residential homes and a family-friendly environment.
4.17 km² · boundary
At a glance
Day to day: Livability
7
Schools near listings
out of 10 · averaged over 434 past and present listings
Fraser Institute ratings within 2 km of each listing, closer schools weighted more
Each score is an average over this area's own listings and is shown only where at least 5 of them carry one. Scores are reported by listing agents, not measured by HOMEH.
What it costs: Affordability
Median asking price
$947,950
In Tyandaga
$947,950
In Burlington
$919,000
In Ontario
$699,900
Median monthly rent
$3,650/mo
In Tyandaga
$3,650
In Burlington
$2,950
In Ontario
$2,500
≈ 21.6 years
Of rent to match the purchase price
On the market: Market snapshot
For sale
20
Median $947,950
Houses 15 · Condos 5
For rent
3
Median $3,650
Recently sold
Sign in to see sold data
Recently leased
Sign in to see leased data
Market data as of 2026-11-12. Sold and leased figures are neighbourhood medians over the last 12 months, published only where at least 5 homes closed — never a single sale.
The honest read: Pros & cons
What people love
- Quiet, family-oriented community
- Good schools with an average rating of 7
- Close to parks and playgrounds
- High home ownership rate
- Diverse community with 23.7% immigrants
Keep in mind
- Prices are above the city median
- Limited public transit options
- Few dining and grocery options
The feel of the place: Lifestyle
Residents enjoy a suburban lifestyle with access to parks and recreational spaces. The area is suitable for families and those seeking a quiet environment.
Within the boundary: What's nearby
The boundary
4.2 km²
Every count and every census figure on this page was measured inside this line — not within a circle drawn around a centre point.
5
Parks
7
Playgrounds
2
Restaurants
Counted across all 4.2 km² of Tyandaga. From OpenStreetMap, as of 2026-11-16.
The people: Who lives here
4,462
Population (2021)
2.3 km²
Area
1,926
People per km²
44.5
Median age
$140,673
Median income
81%
Own their home
2.8
People per household
1,615
Households
Every age
- Children (under 15)18.2%
- Working age (15–64)61.2%
- Seniors (65+)20.6%
What is built here
- Detached houses65.9%
- Semi-detached1.8%
- Townhouses18.6%
- Low-rise apartments4.3%
- High-rise apartments9.1%
Own or rent
81%Owners
20%Renters
Across 1,615 households
When it was built
Mostly 1961–1980
- 1960 or earlier5%
- 1961–198062%
- 1981–199022%
- 1991–20009%
- 2001–20051%
- 2006–20100%
- 2011–20150%
- 2016–20210%
Share of occupied homes, by the era they were built in. Bars are drawn against the busiest era, not against each other, because the eras are not the same length. The eight shares are unlikely to total exactly 100: Statistics Canada rounds each era's count to the nearest 5 before publishing it, so we print what the census reports rather than adjusting a figure to make the column add up.
- Born outside Canada
- 23.7%
- Hold a degree or higher
- 40.5%
- Employment rate
- 57.4%
- Commute by transit
- 4%
- Commute by car
- 90.9%
- Children per family
- 1.8
- Median income after tax
- $116,225
- Average household income
- $172,803
- Living on a low income
- 4.3%
- Renters pay, per month
- $1,500/mo
- Owners pay, per month
- $1,728/mo
- Median home value at census
- $1,050,917
- Renters spending 30%+ of income on housing
- 16.3%
- Owners spending 30%+ of income on housing
- 10.5%
Statistics Canada, Census of Population 2021. Added up from 8 census areas inside the boundary. Medians and rates are a population-weighted average of dissemination-area figures.
Sources: HOMEH listings, Statistics Canada, Census of Population 2021, OpenStreetMap, HOMEH school registry