
Registered
2020
by Cityzen Development Corporation
15 Queens Quay E, Toronto, ON M5E 0A4
Registered
2020
Total units
336
Avg $/sqft
$1,057
Storeys
35
4
Units for sale
From $498,000
Listed 24 days ago
Condo ApartmentFor Sale
Listed Oct 1, 2026
Condo ApartmentFor Sale
5
Units for rent
From $2,400monthly
Listed 20 days ago
Common Element CondoFor Rent
Listed 13 days ago
Condo ApartmentFor Rent
Listed 12 days ago
Condo ApartmentFor Rent
Live MLS · Updated daily
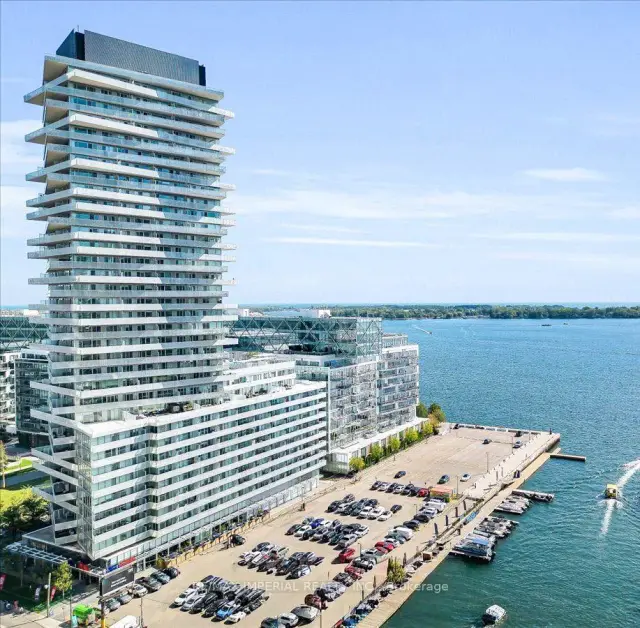
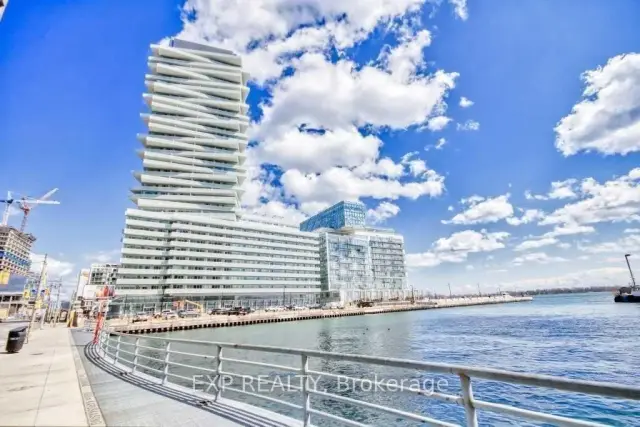
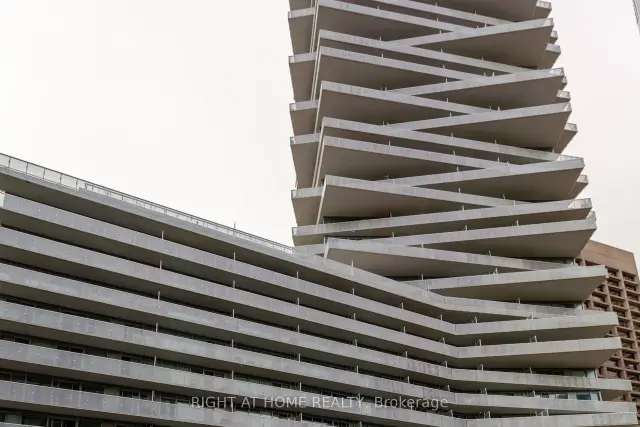
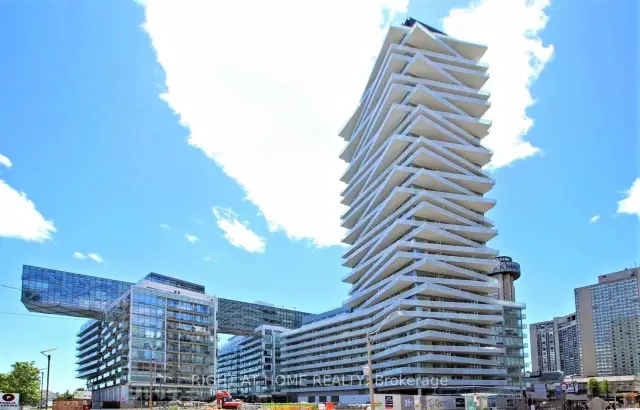
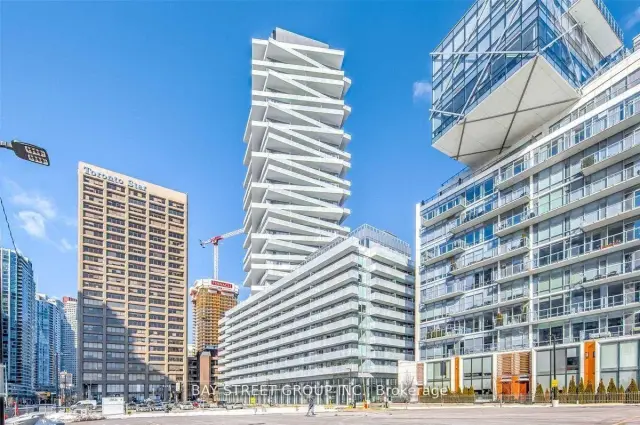
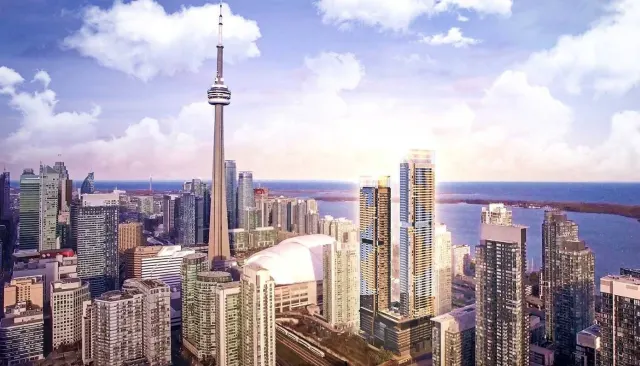
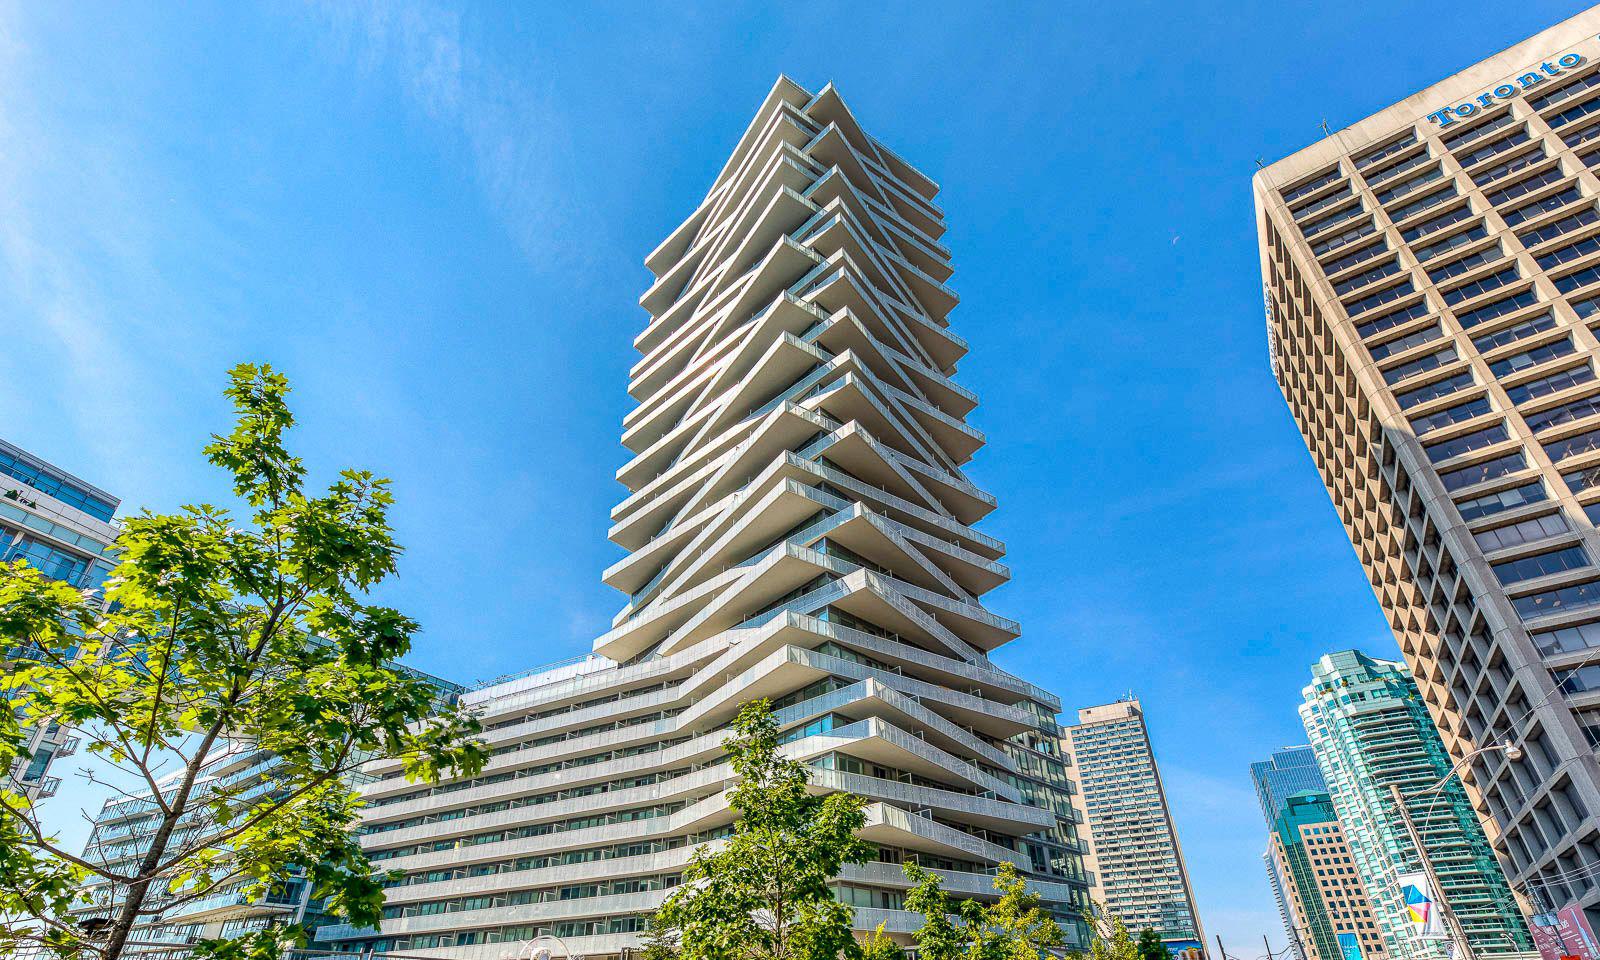
Pier 27 The Tower Condos, also known as Pier 27, is a 35-storey condo building with 336 units at 15 Queens Quay E in The Waterfront, Toronto. It was developed by Cityzen Development Corporation and registered as a condominium in 2020; units on record range from about 500 to 1,400 sq ft. Maintenance fees run $1.05 per sq ft a month (2026), 13% higher than the Toronto average of $0.93, and units sold for an average of $1,057 per sq ft over the last 12 months, 43% higher than the Toronto condo average of $737. Over the last 12 months, 11 units sold and 88 were leased, and sales took a median of 33 days, against a Toronto condo median of 32 days.
Developer
Cityzen Development Corporation
Registered
2020
Property type
High-Rise Condo
Storeys
35
Total units
336
Management
Duka Property Management Inc.
Condo corporation
TSCC 2850
Sold and leased
11 sold · 88 leased
Last 12 months
Also known as
Pier 27
Maintenance fees
$1.05/sq ft
A month, 2026
Above-average fees13% higher than the Toronto average of $0.93/sq ft
Sold price per sq ft
$1,057
Sold, last 12 months
Premium pricing43% higher than the Toronto condo average of $737
Days to sell
33 days
Median, last 12 months
Sells slower3% longer than the Toronto condo median of 32 days
As stated by 294 listings in this building since Nov 2024.
Outdoor pool
Concierge
Gym
Party room
Exercise room
Rooftop deck
$1.05
per sq ft a month, 2026
Up 20.7% from $0.87 in 2025
The Waterfront average in 2026 was $0.93 per sq ft, across 34 other buildings.
Our records for Pier 27 The Tower Condos run from 1-bedroom suites to suites of 3 or more bedrooms. The most common layout is the 2-bedroom, 45% of the 181 homes on record.
24 homes on record
60 homes on record
82 homes on record
4 homes on record
11 homes on record
$1,057
Avg $/sqft
-17.9%
YoY change
33
Days to sell
In 2026, maintenance fees at Pier 27 The Tower Condos averaged about $1.05 per square foot per month, compared with $0.93 across 34 other buildings in The Waterfront. The fee includes common elements, building insurance, parking and central air conditioning.
Pier 27 The Tower Condos was registered as a condominium in 2020.
Pier 27 The Tower Condos has 336 units across 35 storeys.
Right now Pier 27 The Tower Condos has 4 units for sale and 5 for rent on HOMEH.
Pier 27 The Tower Condos is registered as TSCC 2850.
Over the last 12 months, units at Pier 27 The Tower Condos sold in a median of 33 days, against a Toronto condo median of 32 days.
Pier 27 The Tower Condos was developed by Cityzen Development Corporation.
Yes, with restrictions. 84% of the listings at Pier 27 The Tower Condos that answer say pets are allowed with restrictions; the condo's declaration and rules set the details.
Pier 27 The Tower Condos has outdoor pool, concierge, gym, party room, exercise room and rooftop deck. That is what 294 of its listings since Nov 2024 state.
Pier 27 The Tower Condos is managed by DUKA Property Management, the company its listings name.
Counted by HOMEH within 400 m (5 min) and 800 m (10 min) of the building, from map data by © OpenStreetMap contributors, November 2026.
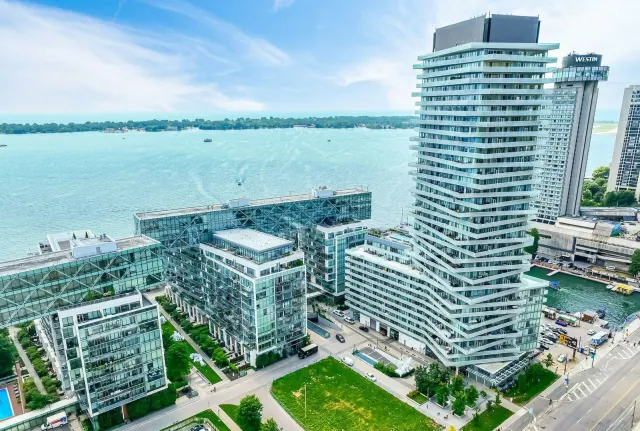 40 m away
29 Queen's Quay E
6 for sale
View building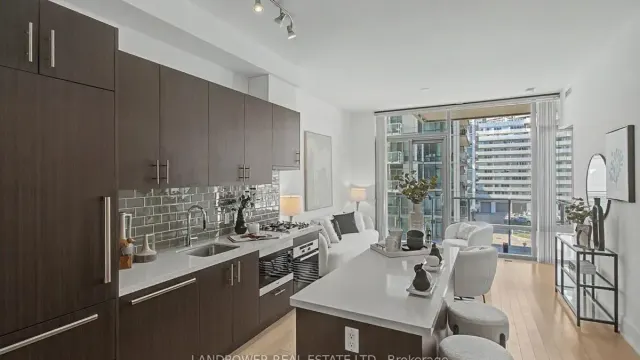 80 m away
39 Queens Quay East
1 sold or leased in the last 12 months
View building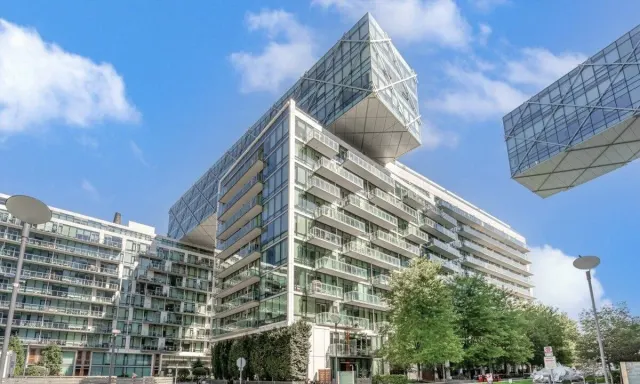 110 m away
39 Queens Quay E
2 for sale6 for rent
View building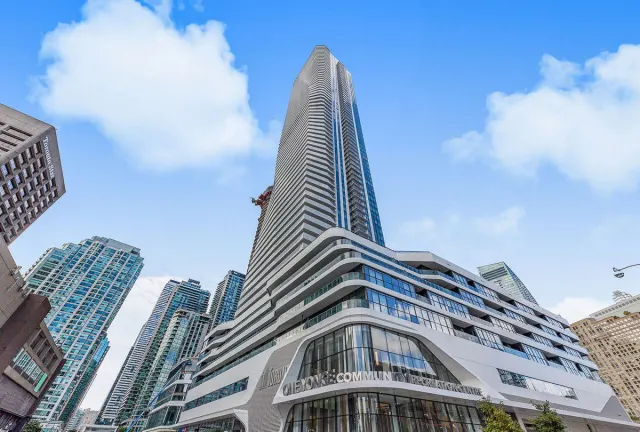 130 m away
1 Yonge Street
7 for sale9 for rent
View building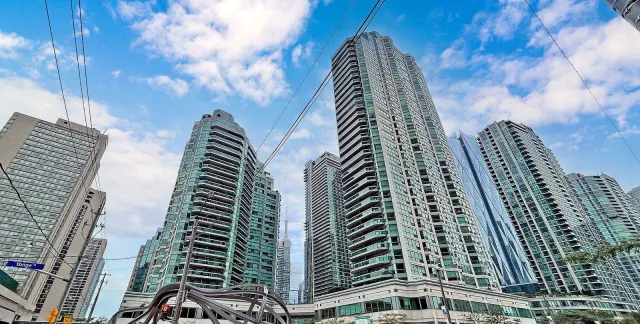 220 m away
10 Yonge Street
7 for sale1 for rent
View building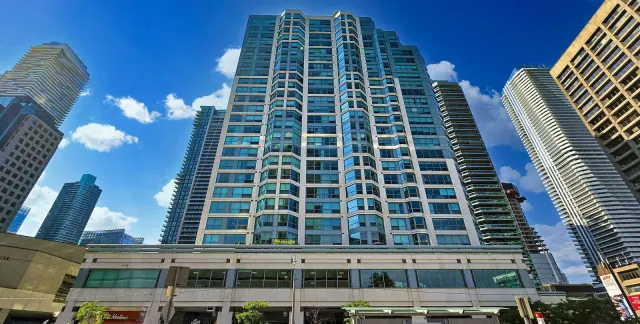 230 m away
10 Queens Quay W
3 for sale2 for rent
View buildingNeighbourhood in Toronto
The Waterfront is a vibrant neighbourhood in Toronto. It offers a mix of parks, restaurants, and schools.
For sale
0
For rent
0
Recently sold
Sign in to see sold data
Recently leased
Sign in to see leased data
Market data as of 2026-08-16. Sold and leased figures are neighbourhood medians over the last 12 months, published only where at least 5 homes closed — never a single sale.
What people love
Keep in mind
Daily life here is active and social, with many dining and leisure options. The area is family-friendly and caters to various lifestyles.
Not enough verified data yet. We count schools, parks, transit and shops inside The Waterfront's real boundary and publish the numbers only once that count is confirmed — an estimate here would be worse than nothing.
1,549
Population (2021)
0.0 km²
Area
42,092
People per km²
38.4
Median age
$95,000
Median income
52%
Own their home
1.6
People per household
980
Households
Every age
What is built here
Own or rent
52%Owners
48%Renters
Across 980 households
When it was built
Mostly 1981–1990
Share of occupied homes, by the era they were built in. Bars are drawn against the busiest era, not against each other, because the eras are not the same length. The eight shares are unlikely to total exactly 100: Statistics Canada rounds each era's count to the nearest 5 before publishing it, so we print what the census reports rather than adjusting a figure to make the column add up.
Statistics Canada, Census of Population 2021. Added up from 1 census area around the listings we hold here. Medians and rates are a population-weighted average of dissemination-area figures.
Sources: HOMEH listings, Statistics Canada, Census of Population 2021, OpenStreetMap, © OpenStreetMap contributors (ODbL)