
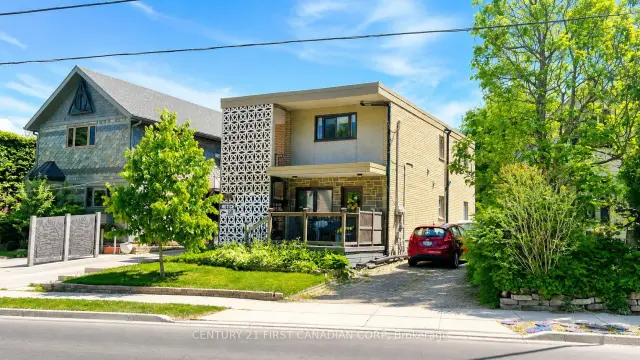
2026-11-01
$925,000
For Sale362 Wortley Road
London (South G), ON N6C 3S2
Multiplex
- 4+1Bedrooms
- 3Bathrooms
- 6Parking
- 1.5K~2K ft²

Loading homes in London…
No listings match these filters in this area.
Try zooming out or widening your filters.
City in Ontario
There are 106 multi-family homes and income properties for sale in London today, with a median asking price of $669,900 (+12% vs. all homes in London). The most active neighbourhoods are London East, London South and London North.
422,324 people lived in London at the 2021 Census, in 174,660 households. 58% of households owned their home and 42% rented. The most common homes were single-detached houses (49%) and apartments in buildings of five or more storeys (22%). 52% of homes were built before 1981, and 11% since 2011. 86% of commuters went to work by car and 6% by public transit.
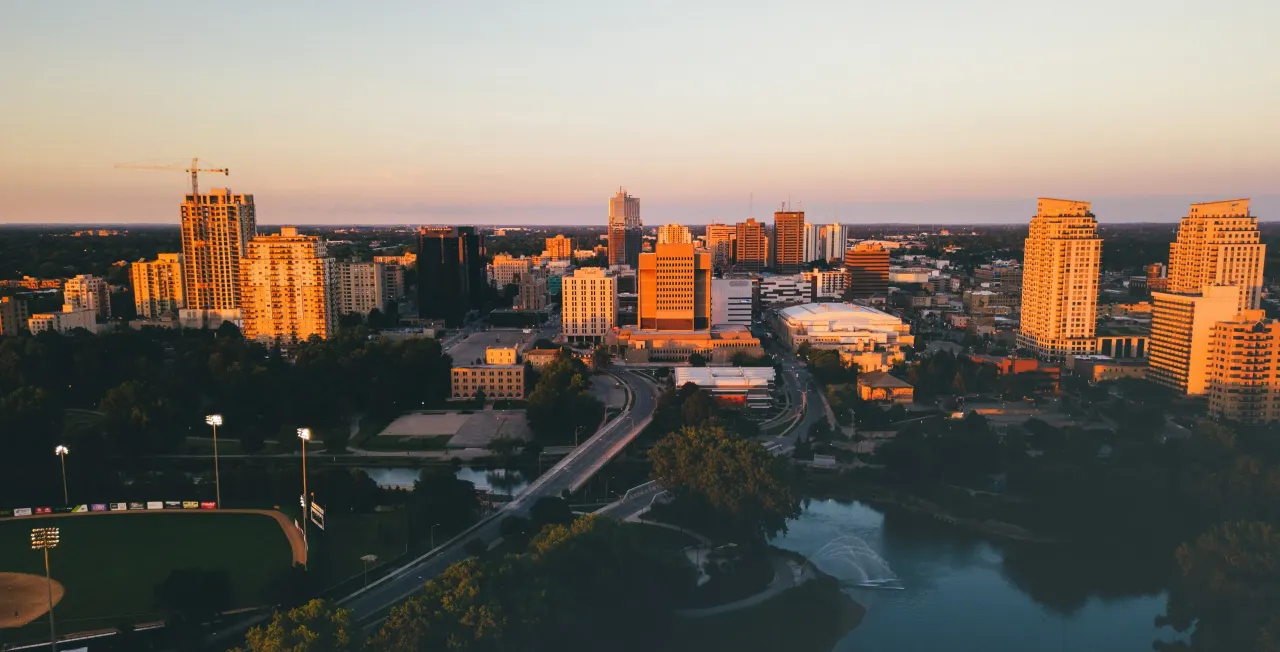
London, Ontario
© Wikimedia Commons contributors (CC BY-SA)
There are 106 multiplexes for sale in London.
2026-11-01
362 Wortley Road
London (South G), ON N6C 3S2
Multiplex
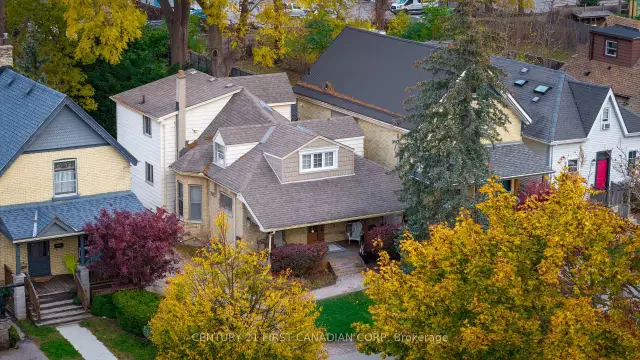
2026-10-29
562 Piccadilly Street
London (East F), ON N5Y 3G8
Multiplex
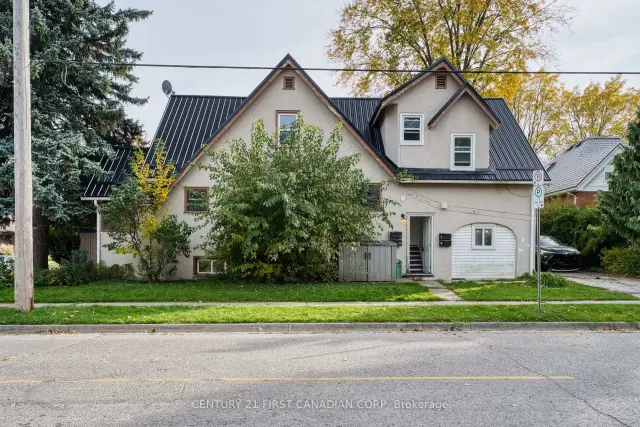
2026-10-28
363 Ashland Avenue
London (East M), ON N5W 4E9
Multiplex
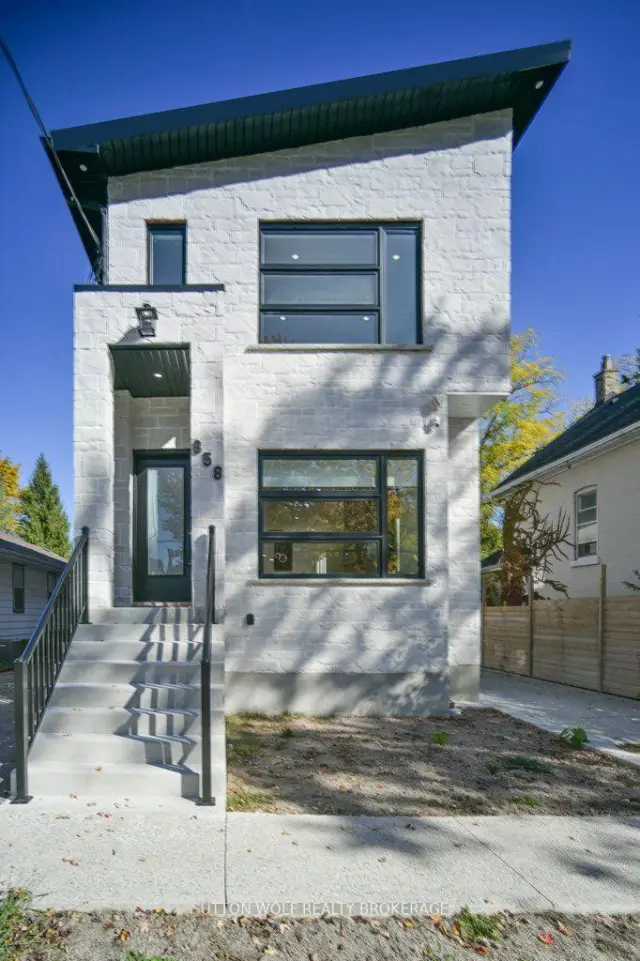
2026-10-26
858 William Street
London (East B), ON N5Y 2S3
Multiplex
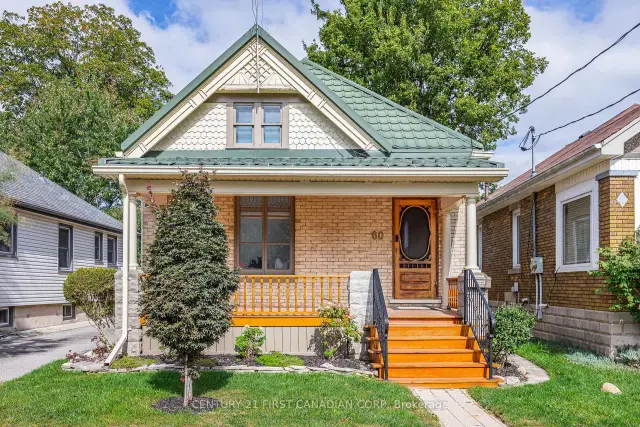
2026-10-22
60 Beattie Avenue
London (East N), ON N5W 2P2
Multiplex
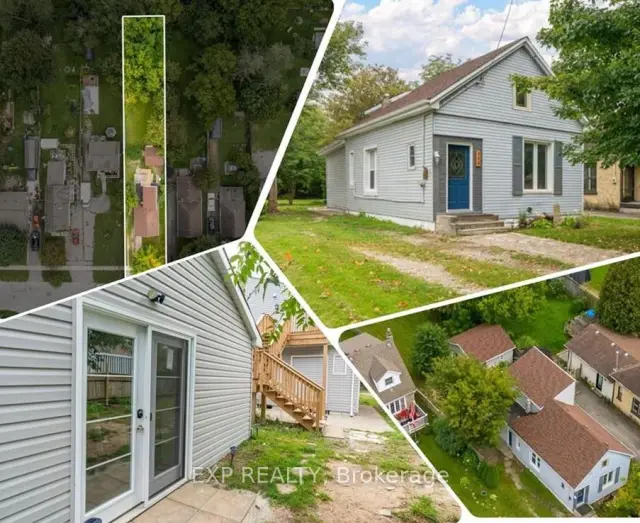
2026-10-21
354 Spruce Street
London (East H), ON N5W 4N7
Multiplex
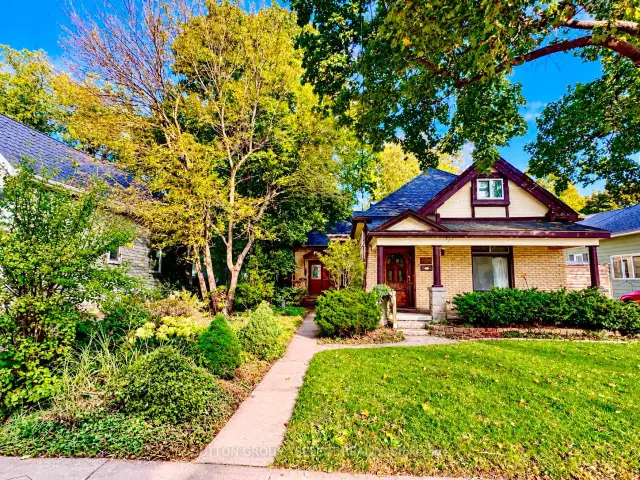
2026-10-21
980 Lorne Avenue
London (East G), ON N5W 3L3
Multiplex
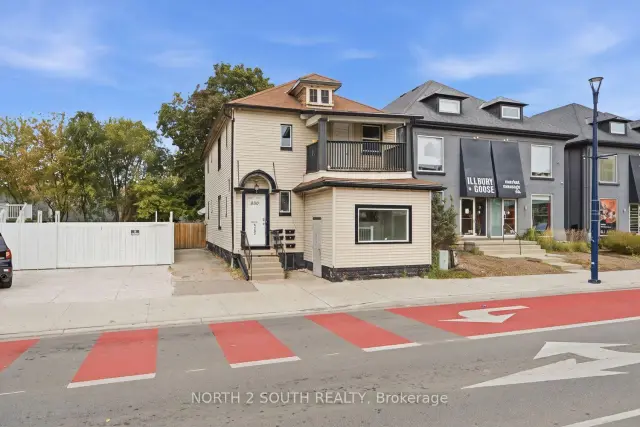
2026-10-20
880 Dundas Street E
London (East L), ON N5W 3A1
Multiplex
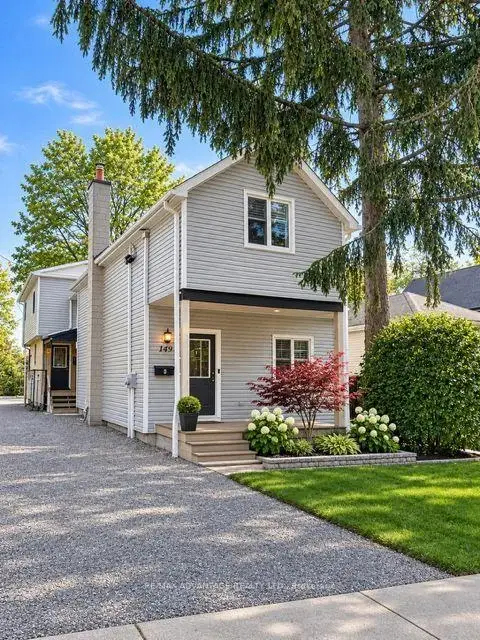
2026-10-20
149 Sydenham Street
London (East B), ON N6A 1W1
Multiplex
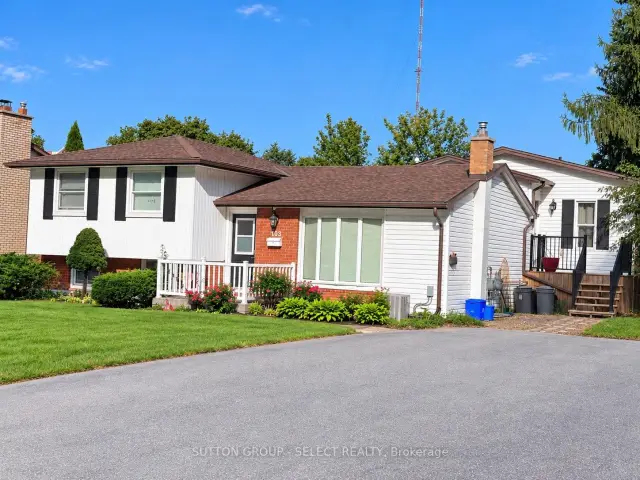
2026-10-19
103 Westbury Avenue
London (South O), ON N6J 3G3
Multiplex
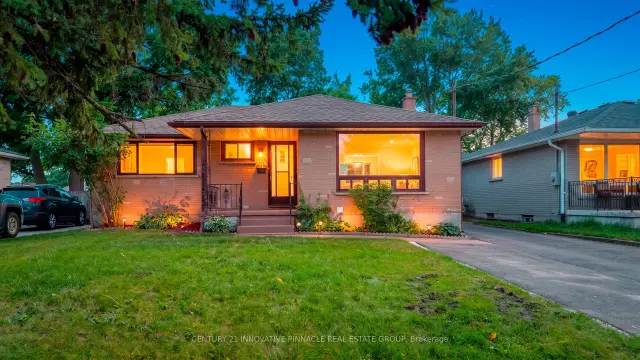
2026-10-17
163 Atkinson Boulevard
London (East H), ON N5W 4Z3
Multiplex
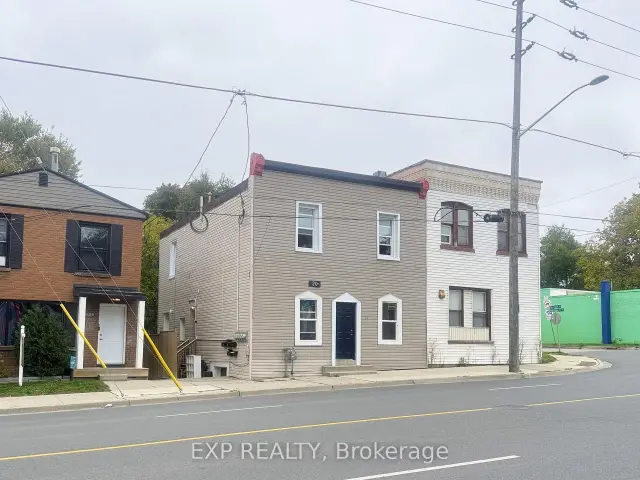
2026-10-17
20 Adelaide Street S
London (South I), ON N5Z 3J8
Multiplex
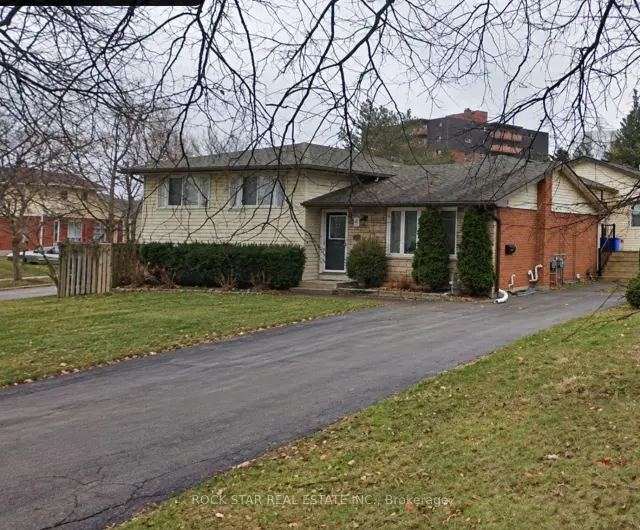
2026-10-15
1 Southwood Crescent
London (South D), ON N6J 1S8
Multiplex
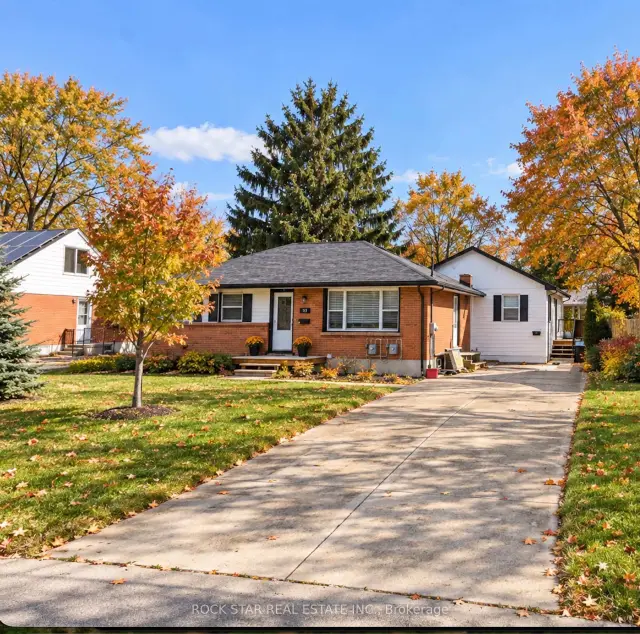
2026-10-13
134 Oakside Street
London (East C), ON N5Y 1E7
Multiplex
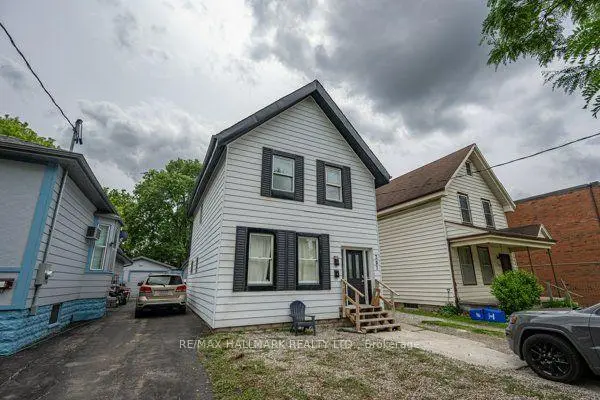
2026-10-09
307 Grey Street
London (East K), ON N6B 1G7
Multiplex
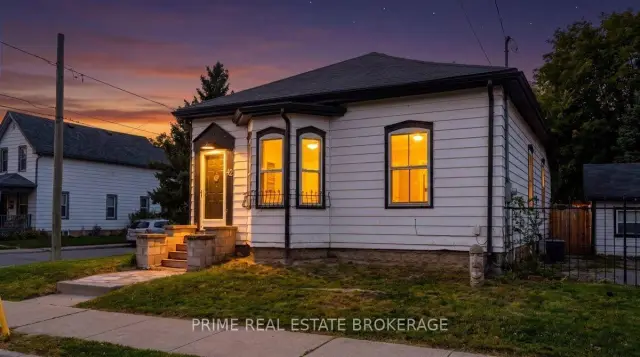
2026-10-09
42 Bruce Street
London (South F), ON N6C 1G6
Multiplex
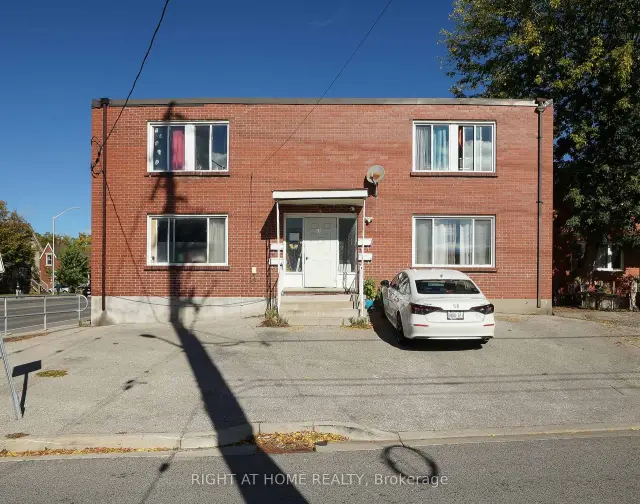
2026-10-08
59 Saunby Street N
London (North K), ON N6G 1A4
Multiplex
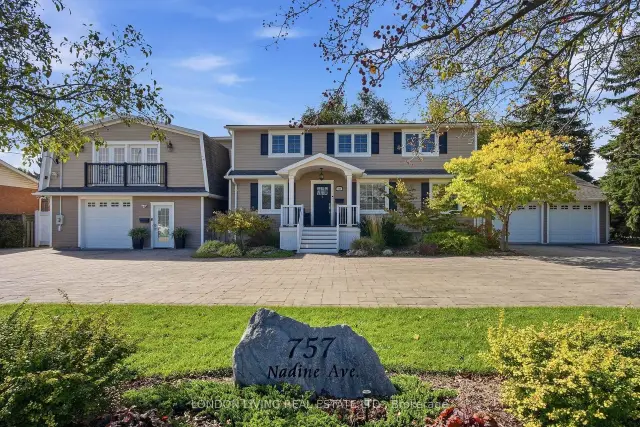
2026-10-06
757 Nadine Avenue
London (South R), ON N6C 4R6
Multiplex
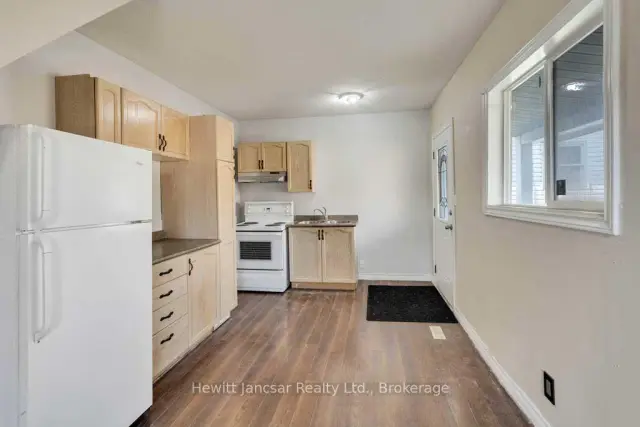
2026-10-01
797 Hamilton Road
London (East M), ON N5Z 1V2
Multiplex
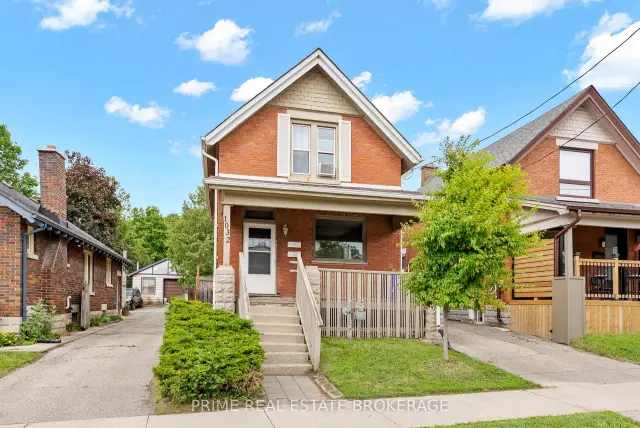
2026-10-01
1032 Trafalgar Street
London (East M), ON N5Z 1G4
Detached
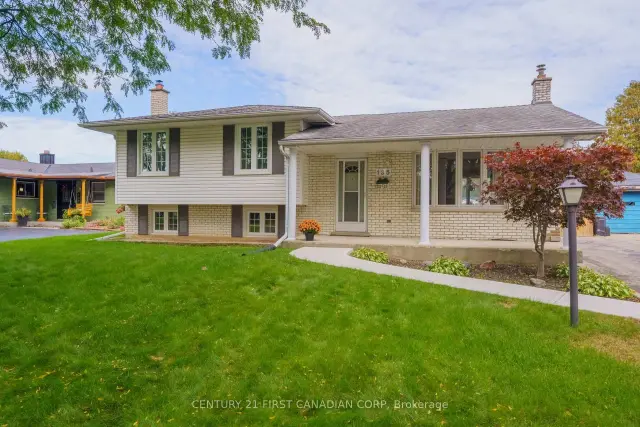
2026-09-30
135 Downing Crescent
London (South S), ON N6C 3C7
Detached
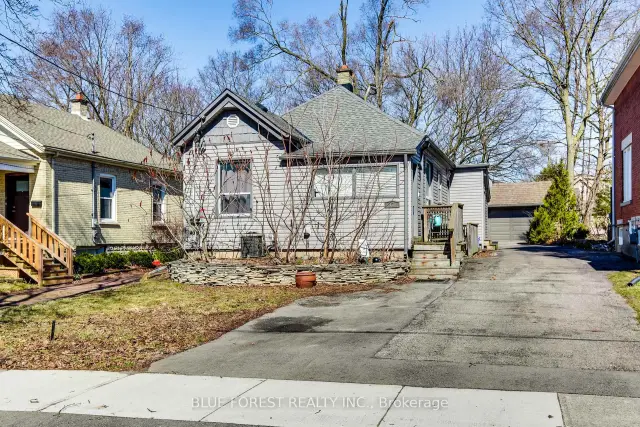
2026-09-30
17 McDonald Avenue
London (North K), ON N6G 1A9
Multiplex
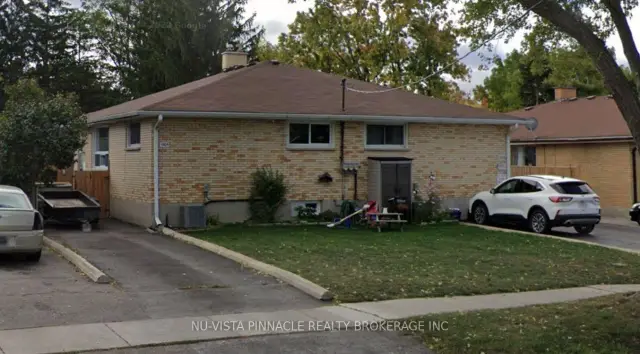
2026-09-26
1905 Wavell Street
London (East H), ON N5W 2E3
Multiplex
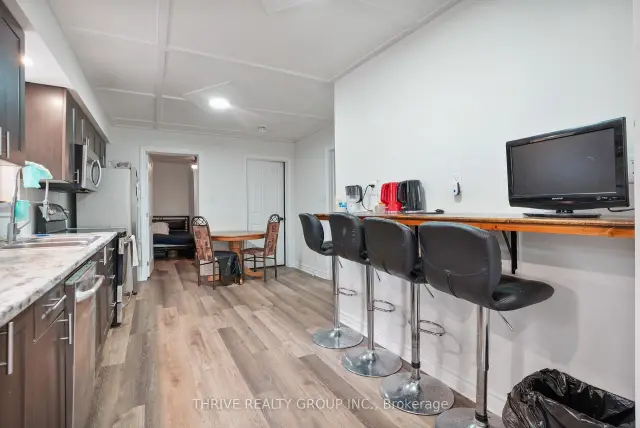
2026-09-25
86 Wilson Avenue
London (North N), ON N6H 1X7
Multiplex
5.7
Schools near listings
out of 10 · averaged over 27,685 past and present listings
Fraser Institute ratings within 2 km of each listing, closer schools weighted more
Each score is an average over this area's own listings and is shown only where at least 5 of them carry one. Scores are reported by listing agents, not measured by HOMEH.
Median asking price
$599,900
In London
$599,900
In Ontario
$699,900
Median monthly rent
$2,150/mo
In London
$2,150
In Ontario
$2,495
$431
Per square foot
≈ 23.3 years
Of rent to match the purchase price
For sale
2,072
Median $599,900
Houses 1,416 · Condos 654
For rent
672
Median $2,150
Houses 417 · Condos 255
Recently sold
Sign in to see sold data
Recently leased
Sign in to see leased data
Market data as of 2026-11-19. Sold and leased figures are neighbourhood medians over the last 12 months, published only where at least 5 homes closed — never a single sale.
What people love
Keep in mind
Daily life in London offers a balance of urban and suburban feel. Residents enjoy access to parks, schools, and various dining options.
The boundary
420.5 km²
Every count and every census figure on this page was measured inside this line — not within a circle drawn around a centre point.
277
Parks
233
Playgrounds
1
Transit stations
57
Grocery stores
290
Restaurants
122
Cafés
59
Gyms
19
Libraries
59
Pharmacies
Counted across all 420.5 km² of London. From OpenStreetMap, as of 2026-11-16.
5.4/10
Average rating of the 109 rated schools in this area
131
Elementary
33
Secondary
Orchard Park Public School
Public · Grades JK–8 · Thames Valley DSB
1st of 3,045 Ontario elementary schools
305 students · EQAO 2024-2025
Masonville Public School
Public · Grades JK–8 · Thames Valley DSB
68th of 3,045 Ontario elementary schools
755 students · EQAO 2024-2025
Jack Chambers Public School
Public · Grades JK–8 · Thames Valley DSB
77th of 3,045 Ontario elementary schools
685 students · EQAO 2024-2025
Old North Public School
Public · Grades JK–8 · Thames Valley DSB
77th of 3,045 Ontario elementary schools
465 students · EQAO 2024-2025
John Dearness Public School
Public · Grades JK–8 · Thames Valley DSB
91st of 3,045 Ontario elementary schools
280 students · EQAO 2024-2025
London Central Secondary School
Public · Grades 9–12 · Thames Valley DSB
33rd of 742 Ontario secondary schools
955 students · EQAO 2024-2025
Ontario Ministry of Education school registry; ratings from the Fraser Institute report card. These are the schools that stand inside London, not a catchment — most Ontario boards do not publish attendance boundaries, and we will not draw a line we cannot source. Confirm enrolment with the school board before you buy.
422,324
Population (2021)
420.5 km²
Area
1,004
People per km²
40.2
Median age
$85,869
Median income
58%
Own their home
2.5
People per household
174,660
Households
Every age
What is built here
Own or rent
58%Owners
42%Renters
Across 174,660 households
When it was built
Mostly 1961–1980
Share of occupied homes, by the era they were built in. Bars are drawn against the busiest era, not against each other, because the eras are not the same length. The eight shares are unlikely to total exactly 100: Statistics Canada rounds each era's count to the nearest 5 before publishing it, so we print what the census reports rather than adjusting a figure to make the column add up.
Statistics Canada, Census of Population 2021. Added up from 570 census areas inside the boundary. Medians and rates are a population-weighted average of dissemination-area figures.
Sources: HOMEH listings, Statistics Canada, Census of Population 2021, OpenStreetMap, Photo: © Wikimedia Commons contributors (CC BY-SA)
At least 105 multiplexes changed hands in London over the 12 months to October 2026. Half sold above $580,676 and half below, 9.0% lower than the 12 months before. A typical multiplex found its buyer in 46 days — 9 days slower than a year ago.
11 of the last 12 months had at least 5 closed multiplexes sales in London. Quieter months are left out rather than shown as a median over a handful of homes, so the totals here are a floor.
The line is the median. The band is the middle half of every sale — how wide it runs tells you how much one multiplex here differs from the next.
What buyers actually paid
$961,700
on a $1,000,000 asking price — under ask by $38,300
From 105 sales that closed here in the last 12 months.
Rent or buy in London
30.9 years
of rent, at the going rate here, adds up to what a multiplex here costs.
Median sold price
$580,676
105 sales
Median rent
$1,568/mo
218 leases
Gross rental yield
3.24%
before costs
Both figures come from deals that actually closed in London over the last 12 months. Gross yield is annual rent divided by price; it does not account for taxes, fees, maintenance, vacancy or financing.
Median days on market, month by month. Taller means slower.
Terracotta marks the last 12 months.
| Month | Closed | Median | Middle half | Days | % of ask |
|---|---|---|---|---|---|
| Sep 2026 | 9 | $525,000 | $480K – $620K | 47 | 96.1% |
| Aug 2026 | 6 | $705,000 | $626K – $785K | 58 | 96.3% |
| Jul 2026 | 9 | $470,000 | $400K – $855K | 27 | 94.0% |
| Jun 2026 | 8 | $517,500 | $461K – $537K | 80 | 94.2% |
| May 2026 | 15 | $585,000 | $460K – $767K | 25 | 95.9% |
| Apr 2026 | 13 | $588,000 | $525K – $685K | 24 | 97.5% |
| Mar 2026 | 12 | $641,250 | $479K – $735K | 41 | 97.3% |
| Feb 2026 | 5 | $542,000 | $495K – $690K | 43 | 95.9% |
| Jan 2026 | 5 | $769,000 | $705K – $790K | 78 | 98.8% |
| Dec 2025 | 9 | $500,000 | $430K – $720K | 91 | 96.0% |
| Nov 2025 | 14 | $605,500 | $555K – $667K | 42 | 96.1% |
| Oct 2025 | 19 | $489,000 | $387K – $628K | 42 | 97.3% |
| Sep 2025 | 8 | $650,000 | $572K – $753K | 35 | 97.1% |
| Aug 2025 | 7 | $535,000 | $462K – $773K | 28 | 96.1% |
| Jul 2025 | 10 | $549,500 | $446K – $808K | 46 | 92.5% |
| Jun 2025 | 10 | $650,000 | $467K – $779K | 34 | 94.0% |
| May 2025 | 9 | $725,000 | $640K – $995K | 49 | 95.4% |
| Apr 2025 | 8 | $957,500 | $708K – $1.07M | 40 | 95.4% |
| Mar 2025 | 8 | $627,604 | $488K – $861K | 27 | 97.6% |
| Feb 2025 | 6 | $740,600 | $634K – $853K | 30 | 97.6% |
| Dec 2024 | 9 | $675,000 | $550K – $745K | 34 | 96.4% |
Multiplexes in London sold for a median of $580,676 over the 12 months to October 2026, across at least 105 closed sales — half sold for more and half for less. That is 9.0% lower than the 12 months before it.
A multiplex in London took a median of 46 days on the market over the 12 months to October 2026. Multiplexes there closed at 96.2% of the asking price on average, with 14.3% selling over asking.
The median multiplex lease in London closed at $1,568 a month over the 12 months to October 2026, across at least 218 leases.
A multiplex in London costs about 30.9 years of the rent on one — the median price of $580,676 against a median rent of $1,568 a month, a gross yield of 3.24%. The shorter that number, the closer buying is to renting before financing costs.
Compiled by HOMEH from sales reported closed in London on the Toronto Regional Real Estate Board MLS® System, through October 2026. Medians are taken over closed prices, not asking prices. Per-square-foot figures use the midpoint of the banded floor-area range MLS® carries, so they describe the group and not any one multiplex. Not an appraisal or an opinion of value.
2,072 homes are for sale in London. Browse by neighbourhood or home type below — and get the industry's highest Cashback Rebate when you buy with HOMEH.