
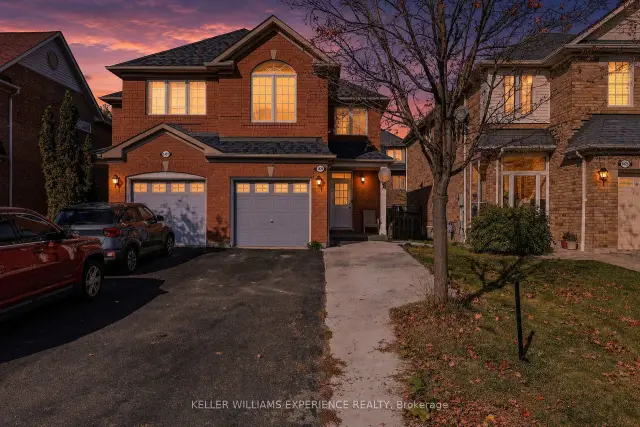
2026-11-20
$889,999
For Sale1429 Weir Chase
Mississauga (East Credit), ON L5V 2X1
Semi-Detached
- 3+1Bedrooms
- 3Bathrooms
- 1Garage
- 1.1K~1.5K ft²

Loading homes in Mississauga…
No listings match these filters in this area.
Try zooming out or widening your filters.
City in Ontario
There are 167 semi-detached homes for sale in Mississauga today, with a median asking price of $913,950 (+6% vs. all homes in Mississauga). The most active neighbourhoods are Churchill Meadows, Malton and Meadowvale Village.
717,204 people lived in Mississauga at the 2021 Census, in 244,355 households. 70% of households owned their home and 29% rented. The most common homes were single-detached houses (37%) and apartments in buildings of five or more storeys (27%). 38% of homes were built before 1981, and 7% since 2011. 83% of commuters went to work by car and 11% by public transit.
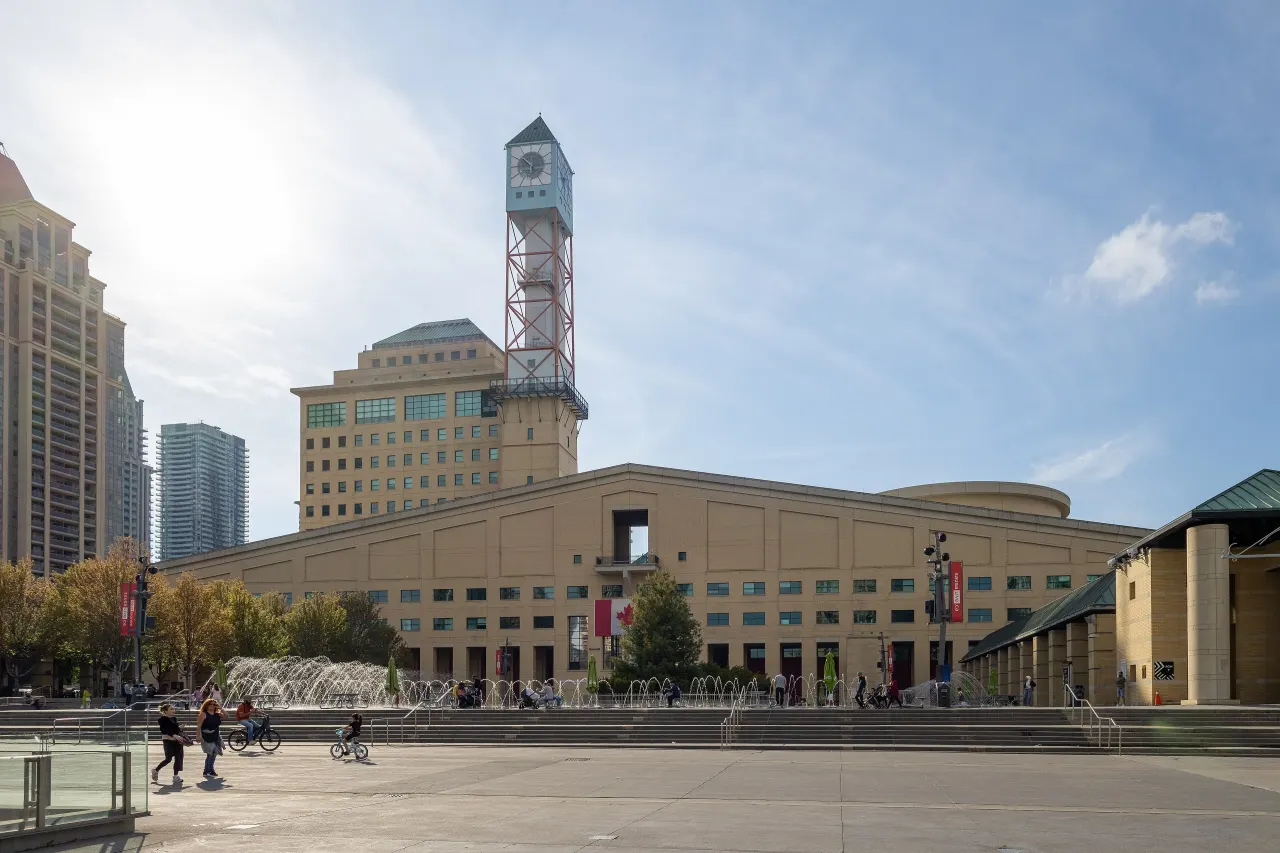
Mississauga, Ontario
© Wikimedia Commons contributors (CC BY-SA)
There are 167 semi-detached houses for sale in Mississauga.
2026-11-20
1429 Weir Chase
Mississauga (East Credit), ON L5V 2X1
Semi-Detached
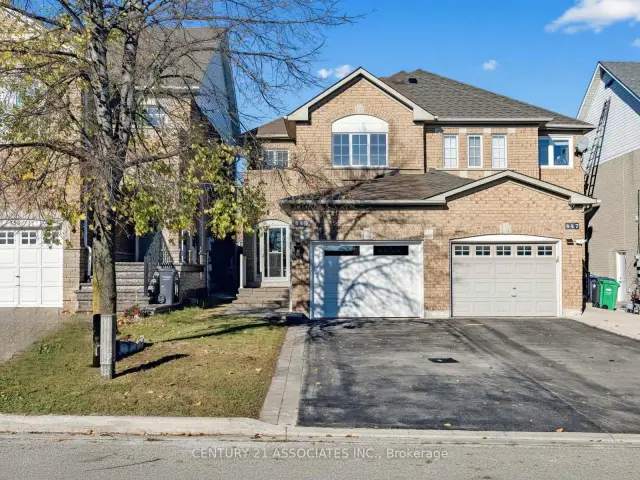
2026-11-19
449 Stonetree Court
Mississauga (Cooksville), ON L5B 4H3
Semi-Detached
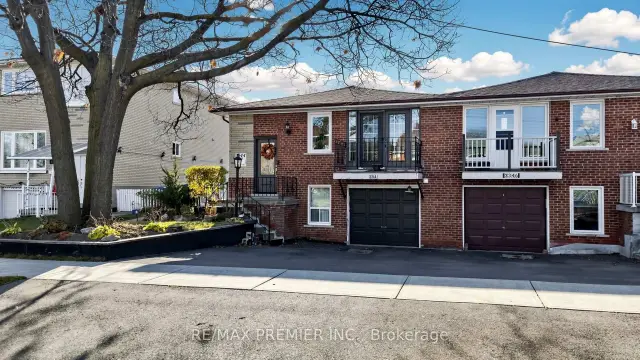
2026-11-19
3344 Ellengale Drive
Mississauga (Erindale), ON L5C 1Z4
Semi-Detached
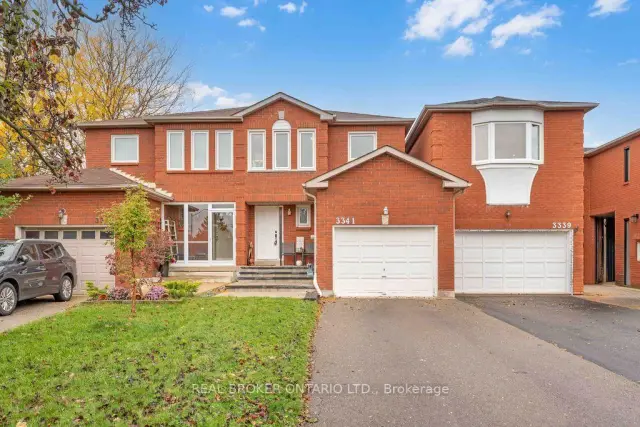
2026-11-18
3341 Bobwhite Mews
Mississauga (Lisgar), ON L5N 6E8
Semi-Detached
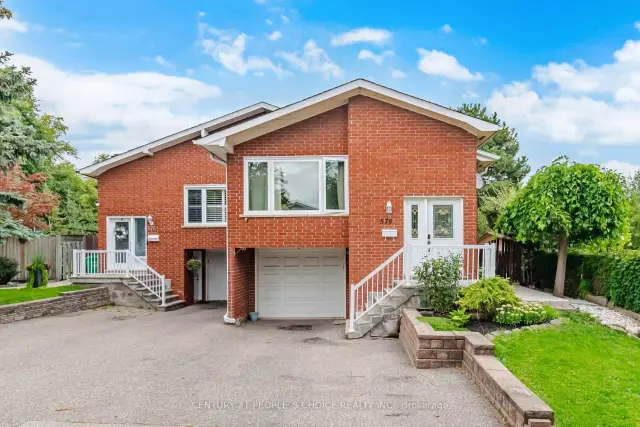
2026-11-18
578 Cavell Drive
Mississauga (Cooksville), ON L5B 2N9
Semi-Detached
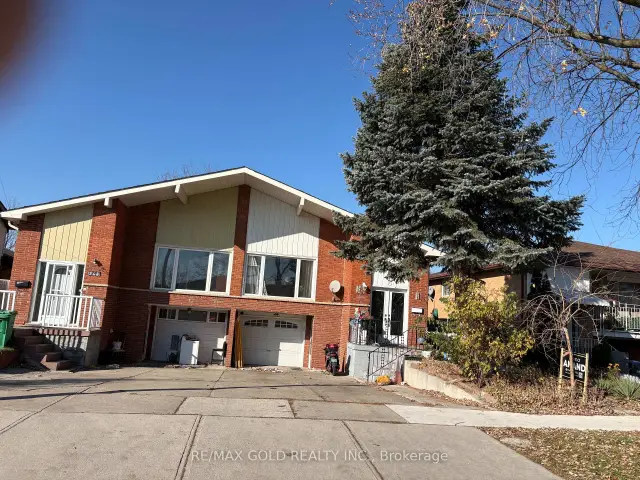
2026-11-18
7745 Wildfern Drive
Mississauga (Malton), ON L4T 3P8
Semi-Detached
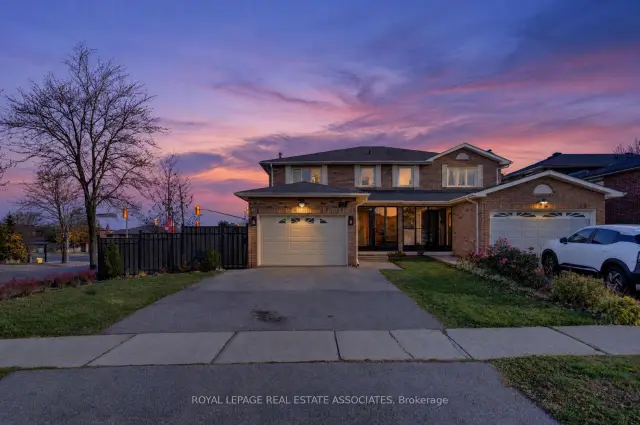
2026-11-18
23 Chalfield Lane
Mississauga (Rathwood), ON L4Z 1K8
Semi-Detached
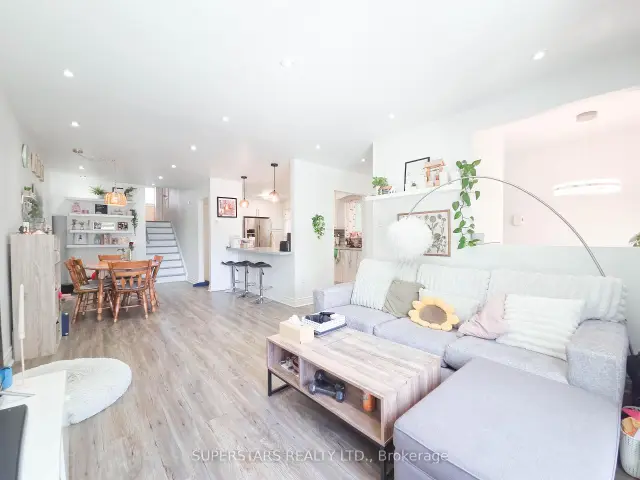
2026-11-18
7553 Wildfern Drive
Mississauga (Malton), ON L4T 3P7
Semi-Detached
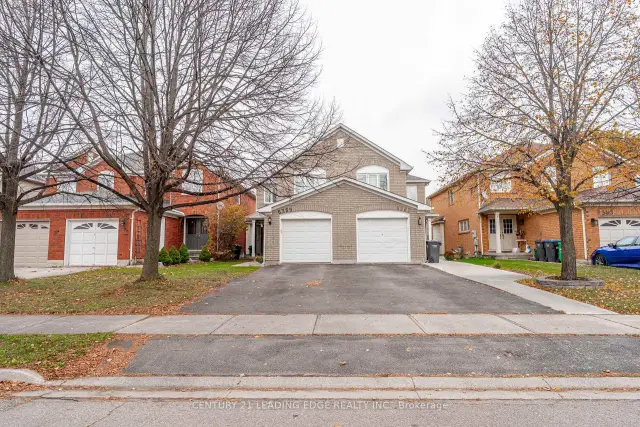
2026-11-17
6369 Amber Glen Drive
Mississauga (Lisgar), ON L5N 7V8
Semi-Detached
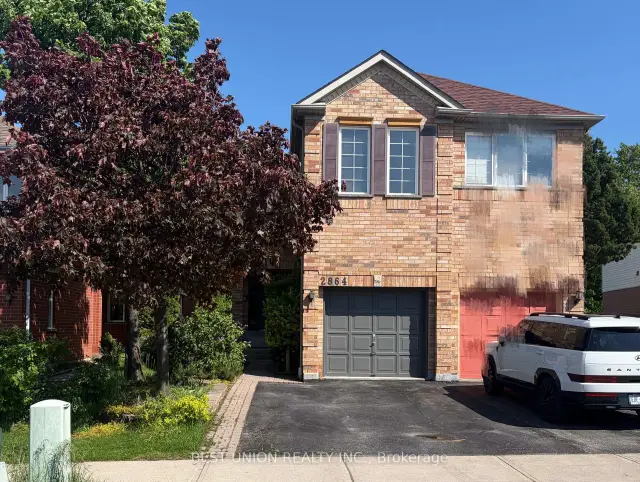
2026-11-17
2864 Westbury Court
Mississauga (Central Erin Mills), ON L5M 6B3
Semi-Detached
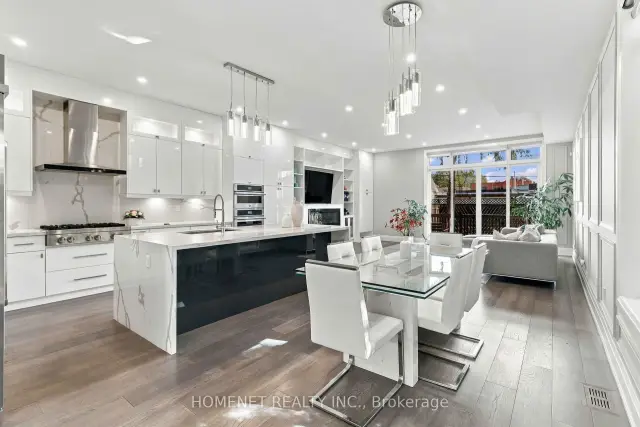
2026-11-17
25A Tecumseth Avenue
Mississauga (Port Credit), ON L5G 1K5
Semi-Detached
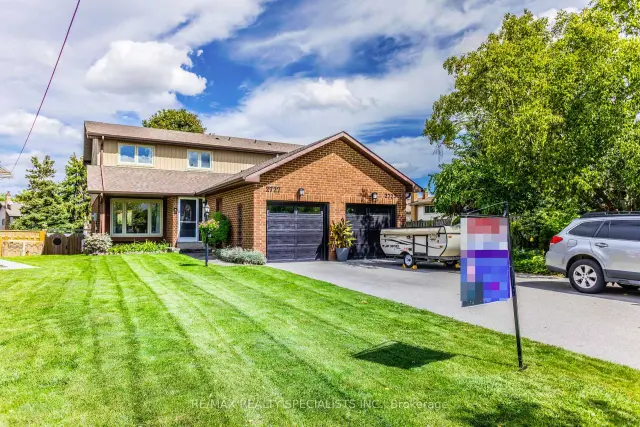
2026-11-17
2727 Los Palmas Court
Mississauga (Meadowvale), ON L5N 2G6
Semi-Detached
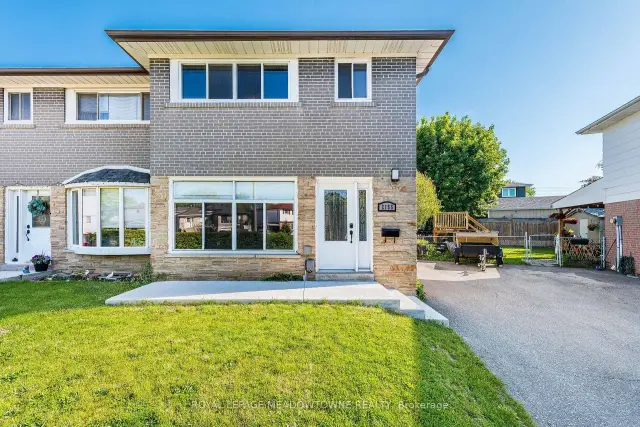
2026-11-16
2155 Pashak Court
Mississauga (Cooksville), ON L5A 1H8
Semi-Detached
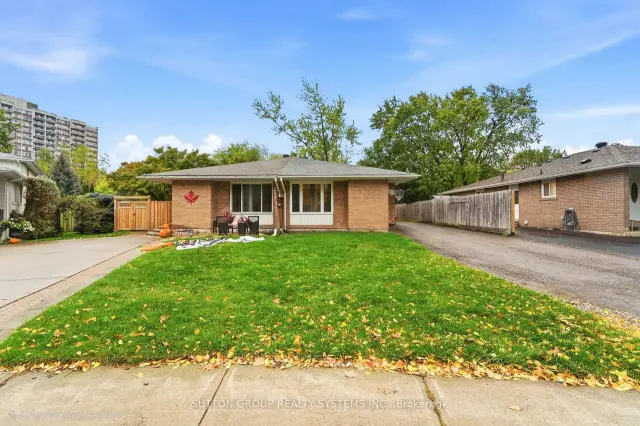
2026-11-16
1916 Reiss Court
Mississauga (Clarkson), ON L5J 3S3
Semi-Detached
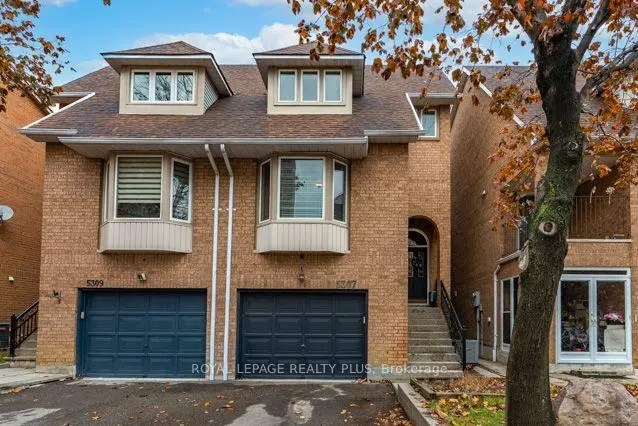
2026-11-14
5307 Ferret Court
Mississauga (Hurontario), ON L4Z 3M4
Semi-Detached
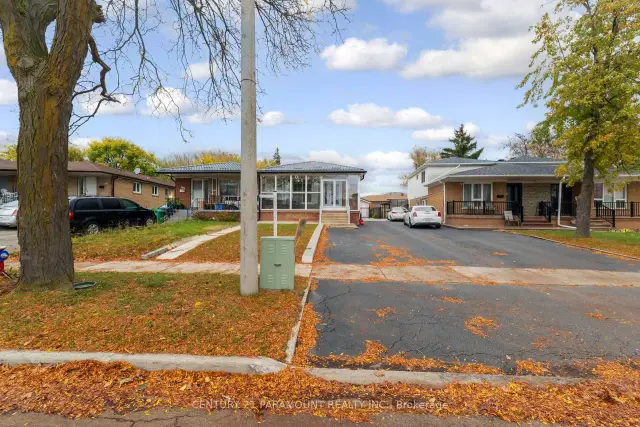
2026-11-14
3135 Purnell Court
Mississauga (Malton), ON L4T 2J7
Semi-Detached
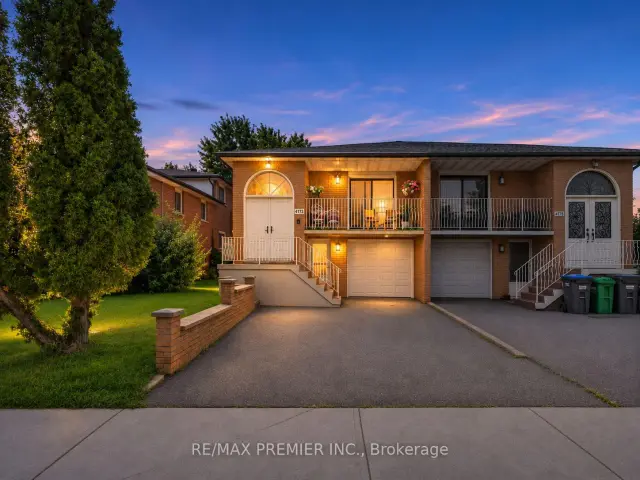
2026-11-13
4178 Dursley Crescent
Mississauga (Rathwood), ON L4Z 1J7
Semi-Detached
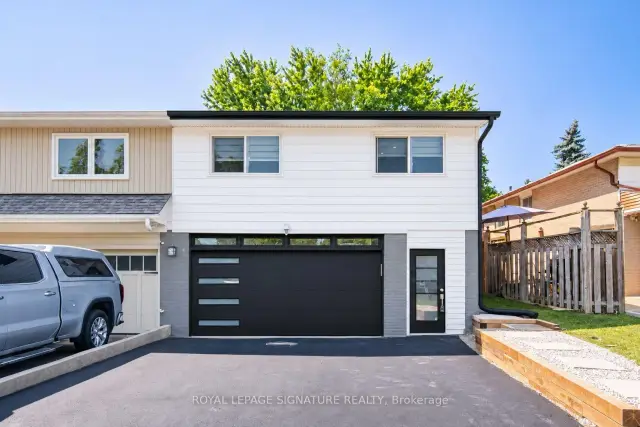
2026-11-13
2599 Lundene Road
Mississauga (Clarkson), ON L5J 3Y8
Semi-Detached
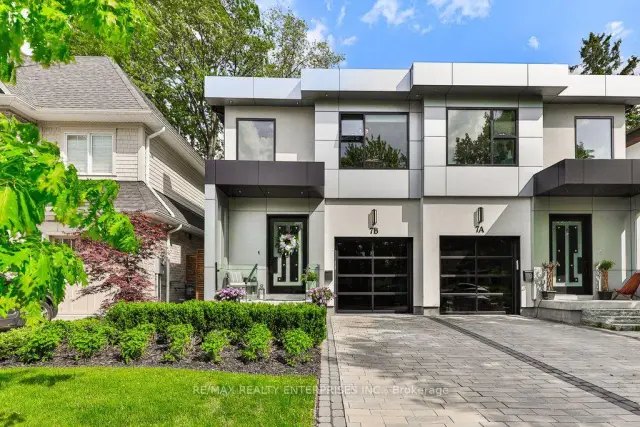
2026-11-13
7B Iroquois Avenue
Mississauga (Port Credit), ON L5G 1M7
Semi-Detached
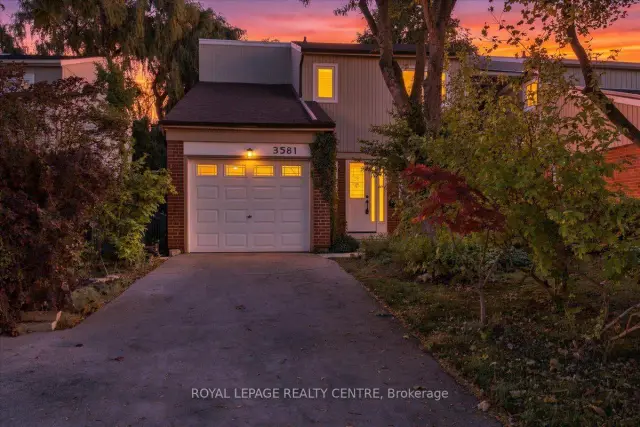
2026-11-12
3581 Ash Row Crescent
Mississauga (Erin Mills), ON L5L 1K3
Semi-Detached
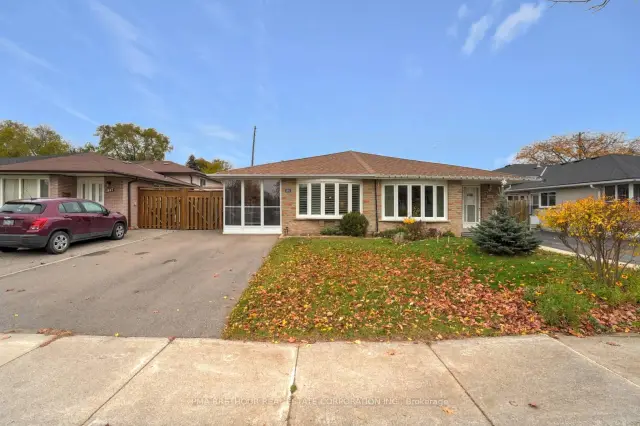
2026-11-12
1843 Bonnymede Drive
Mississauga (Clarkson), ON L5J 1E2
Semi-Detached
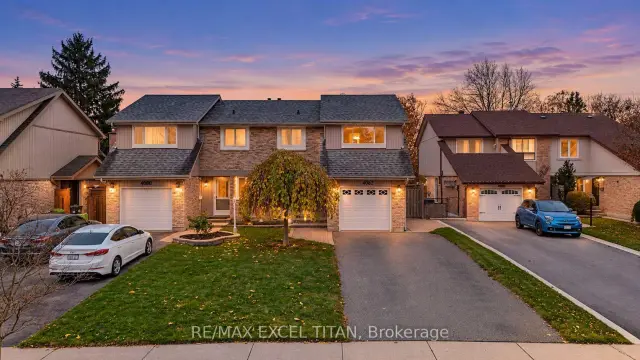
2026-11-12
4082 Jefton Crescent
Mississauga (Erin Mills), ON L5L 1Z3
Semi-Detached
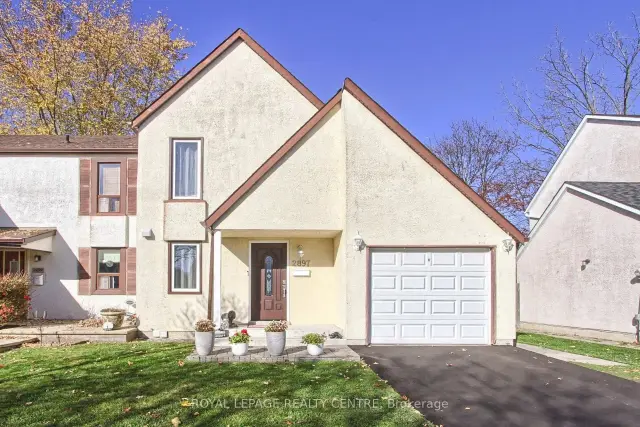
2026-11-12
2897 Nipiwin Drive
Mississauga (Meadowvale), ON L5N 1Y1
Semi-Detached
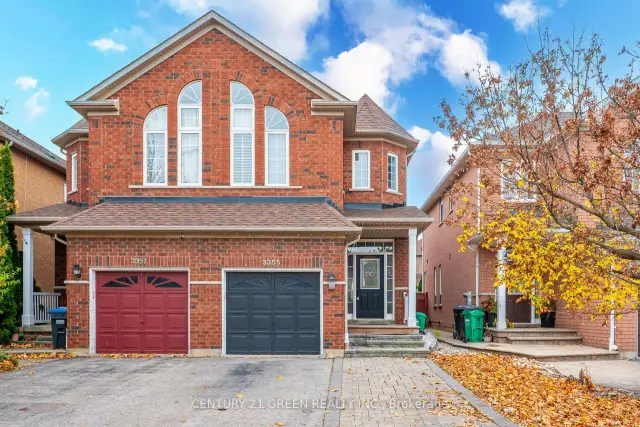
2026-11-12
3355 Fountain Park Avenue
Mississauga (Churchill Meadows), ON L5M 7E2
Semi-Detached
7745 Wildfern Drive
Mississauga (Malton)
Listed 2 days ago
Semi-DetachedFor Sale
Listed 3 days ago
Semi-DetachedFor Sale
Listed 3 days ago
Semi-DetachedFor Sale
Listed 3 days ago
Semi-DetachedFor Sale
Listed 4 days ago
Semi-DetachedFor Sale
Listed 6 days ago
Semi-DetachedFor Sale
Listed 7 days ago
Semi-DetachedFor Sale
Listed 7 days ago
Semi-DetachedFor Sale
Listed 8 days ago
Semi-DetachedFor Sale
86
Walkability
out of 100 · averaged over 21 past and present listings
Average walk score reported on listings here
6.8
Schools near listings
out of 10 · averaged over 59,176 past and present listings
Fraser Institute ratings within 2 km of each listing, closer schools weighted more
Each score is an average over this area's own listings and is shown only where at least 5 of them carry one. Scores are reported by listing agents, not measured by HOMEH.
Median asking price
$859,990
In Mississauga
$859,990
In Ontario
$699,900
Median monthly rent
$2,600/mo
In Mississauga
$2,600
In Ontario
$2,495
$792
Per square foot
≈ 27.6 years
Of rent to match the purchase price
For sale
2,206
Median $859,990
Condos 1,112 · Houses 1,094
For rent
1,248
Median $2,600
Condos 676 · Houses 572
Recently sold
Sign in to see sold data
Recently leased
Sign in to see leased data
Market data as of 2026-11-19. Sold and leased figures are neighbourhood medians over the last 12 months, published only where at least 5 homes closed — never a single sale.
What people love
Keep in mind
Residents enjoy a suburban lifestyle with easy access to urban amenities. Daily life includes plenty of parks, shopping, and dining options.
The boundary
290.5 km²
Every count and every census figure on this page was measured inside this line — not within a circle drawn around a centre point.
425
Parks
622
Playgrounds
13
Transit stations
136
Grocery stores
635
Restaurants
225
Cafés
103
Gyms
20
Libraries
176
Pharmacies
Counted across all 290.5 km² of Mississauga. From OpenStreetMap, as of 2026-11-16.
6.8/10
Average rating of the 132 rated schools in this area
247
Elementary
79
Secondary
Khalsa School Malton
Independent · TO Private Inspected
1st of 3,045 Ontario elementary schools
24 students
St Edmund Separate School
Catholic · Grades JK–8 · Dufferin-Peel CDSB
1st of 3,045 Ontario elementary schools
400 students · EQAO 2024-2025
St Rose of Lima Separate School
Catholic · Grades JK–8 · Dufferin-Peel CDSB
23rd of 3,045 Ontario elementary schools
255 students · EQAO 2024-2025
Kenollie Public School
Public · Grades JK–8 · Peel DSB
29th of 3,045 Ontario elementary schools
185 students · EQAO 2024-2025
Olive Grove
Independent · TO Private Non-Inspected
29th of 3,045 Ontario elementary schools
94 students
Olive Grove High School
Independent · n/a
7th of 742 Ontario secondary schools
Ontario Ministry of Education school registry; ratings from the Fraser Institute report card. These are the schools that stand inside Mississauga, not a catchment — most Ontario boards do not publish attendance boundaries, and we will not draw a line we cannot source. Confirm enrolment with the school board before you buy.
717,204
Population (2021)
292.4 km²
Area
2,453
People per km²
41.5
Median age
$112,315
Median income
70%
Own their home
3
People per household
244,355
Households
Every age
What is built here
Own or rent
70%Owners
29%Renters
Across 244,355 households
When it was built
Mostly 1961–1980
Share of occupied homes, by the era they were built in. Bars are drawn against the busiest era, not against each other, because the eras are not the same length. The eight shares are unlikely to total exactly 100: Statistics Canada rounds each era's count to the nearest 5 before publishing it, so we print what the census reports rather than adjusting a figure to make the column add up.
Statistics Canada, Census of Population 2021. Added up from 968 census areas inside the boundary. Medians and rates are a population-weighted average of dissemination-area figures.
Sources: HOMEH listings, Statistics Canada, Census of Population 2021, OpenStreetMap, Photo: © Wikimedia Commons contributors (CC BY-SA)
765 semi-detached houses changed hands in Mississauga over the 12 months to October 2026. Half sold above $893,105 and half below, 6.7% lower than the 12 months before. A typical semi-detached house found its buyer in 21 days.
The line is the median. The band is the middle half of every sale — how wide it runs tells you how much one semi-detached house here differs from the next.
What buyers actually paid
$975,700
on a $1,000,000 asking price — under ask by $24,300
From 765 sales that closed here in the last 12 months.
Rent or buy in Mississauga
24.8 years
of rent, at the going rate here, adds up to what a semi-detached house here costs.
Median sold price
$893,105
765 sales
Median rent
$2,998/mo
782 leases
Gross rental yield
4.03%
before costs
Both figures come from deals that actually closed in Mississauga over the last 12 months. Gross yield is annual rent divided by price; it does not account for taxes, fees, maintenance, vacancy or financing.
Median days on market, month by month. Taller means slower.
Terracotta marks the last 12 months.
| Month | Closed | Median | Middle half | Days | % of ask |
|---|---|---|---|---|---|
| Oct 2026 | 67 | $875,000 | $804K – $937K | 24 | 97.4% |
| Sep 2026 | 71 | $865,000 | $787K – $919K | 25 | 97.1% |
| Aug 2026 | 66 | $881,000 | $820K – $939K | 21 | 97.2% |
| Jul 2026 | 70 | $878,500 | $841K – $930K | 24 | 97.4% |
| Jun 2026 | 85 | $880,000 | $831K – $955K | 16 | 98.2% |
| May 2026 | 75 | $910,000 | $830K – $958K | 18 | 97.2% |
| Apr 2026 | 69 | $902,000 | $830K – $960K | 17 | 97.7% |
| Mar 2026 | 63 | $901,000 | $848K – $966K | 18 | 98.0% |
| Feb 2026 | 42 | $902,000 | $827K – $950K | 21 | 97.7% |
| Jan 2026 | 53 | $902,000 | $823K – $950K | 24 | 98.2% |
| Dec 2025 | 39 | $899,000 | $835K – $961K | 22 | 98.0% |
| Nov 2025 | 65 | $934,500 | $870K – $960K | 24 | 97.1% |
| Oct 2025 | 77 | $900,000 | $838K – $967K | 19 | 98.5% |
| Sep 2025 | 65 | $913,000 | $857K – $985K | 20 | 98.3% |
| Aug 2025 | 60 | $938,554 | $864K – $992K | 21 | 98.5% |
| Jul 2025 | 85 | $945,000 | $880K – $1.02M | 22 | 97.9% |
| Jun 2025 | 72 | $970,000 | $900K – $1.04M | 19 | 97.8% |
| May 2025 | 71 | $950,000 | $908K – $1.03M | 15 | 98.5% |
| Apr 2025 | 64 | $980,000 | $910K – $1.06M | 19 | 98.3% |
| Mar 2025 | 71 | $985,000 | $935K – $1.06M | 18 | 98.3% |
| Feb 2025 | 51 | $975,000 | $915K – $1.06M | 16 | 99.5% |
| Jan 2025 | 43 | $1,030,000 | $973K – $1.09M | 23 | 97.7% |
| Dec 2024 | 43 | $1,011,000 | $941K – $1.06M | 28 | 98.2% |
| Nov 2024 | 30 | $942,500 | $896K – $1.01M | 20 | 98.6% |
Semi-detached houses in Mississauga sold for a median of $893,105 over the 12 months to October 2026, across 765 closed sales — half sold for more and half for less. That is 6.7% lower than the 12 months before it.
A semi-detached house in Mississauga took a median of 21 days on the market over the 12 months to October 2026. Semi-detached houses there closed at 97.6% of the asking price on average, with 23.8% selling over asking.
The median semi-detached house lease in Mississauga closed at $2,998 a month over the 12 months to October 2026, across 782 leases.
A semi-detached house in Mississauga costs about 24.8 years of the rent on one — the median price of $893,105 against a median rent of $2,998 a month, a gross yield of 4.03%. The shorter that number, the closer buying is to renting before financing costs.
Compiled by HOMEH from sales reported closed in Mississauga on the Toronto Regional Real Estate Board MLS® System, through October 2026. Medians are taken over closed prices, not asking prices. Per-square-foot figures use the midpoint of the banded floor-area range MLS® carries, so they describe the group and not any one semi-detached house. Not an appraisal or an opinion of value.
2,206 homes are for sale in Mississauga. Browse by neighbourhood or home type below — and get the industry's highest Cashback Rebate when you buy with HOMEH.